Introduction
Turkish stock market headlines often celebrate record highs. BIST 100 has surged from around 50,000 in 2010 to over 11 million by late 2025 - a staggering 220x increase in Turkish Lira terms.
But there’s a fundamental question here: does nominal growth in a depreciating currency actually represent wealth creation? To answer this, I analyzed BIST 100 performance through three different lenses: nominal TRY terms, USD-adjusted terms, and inflation-adjusted real returns.
The results reveal a significant disconnect between nominal performance and actual purchasing power.
Perspective 1: Turkish Lira Terms
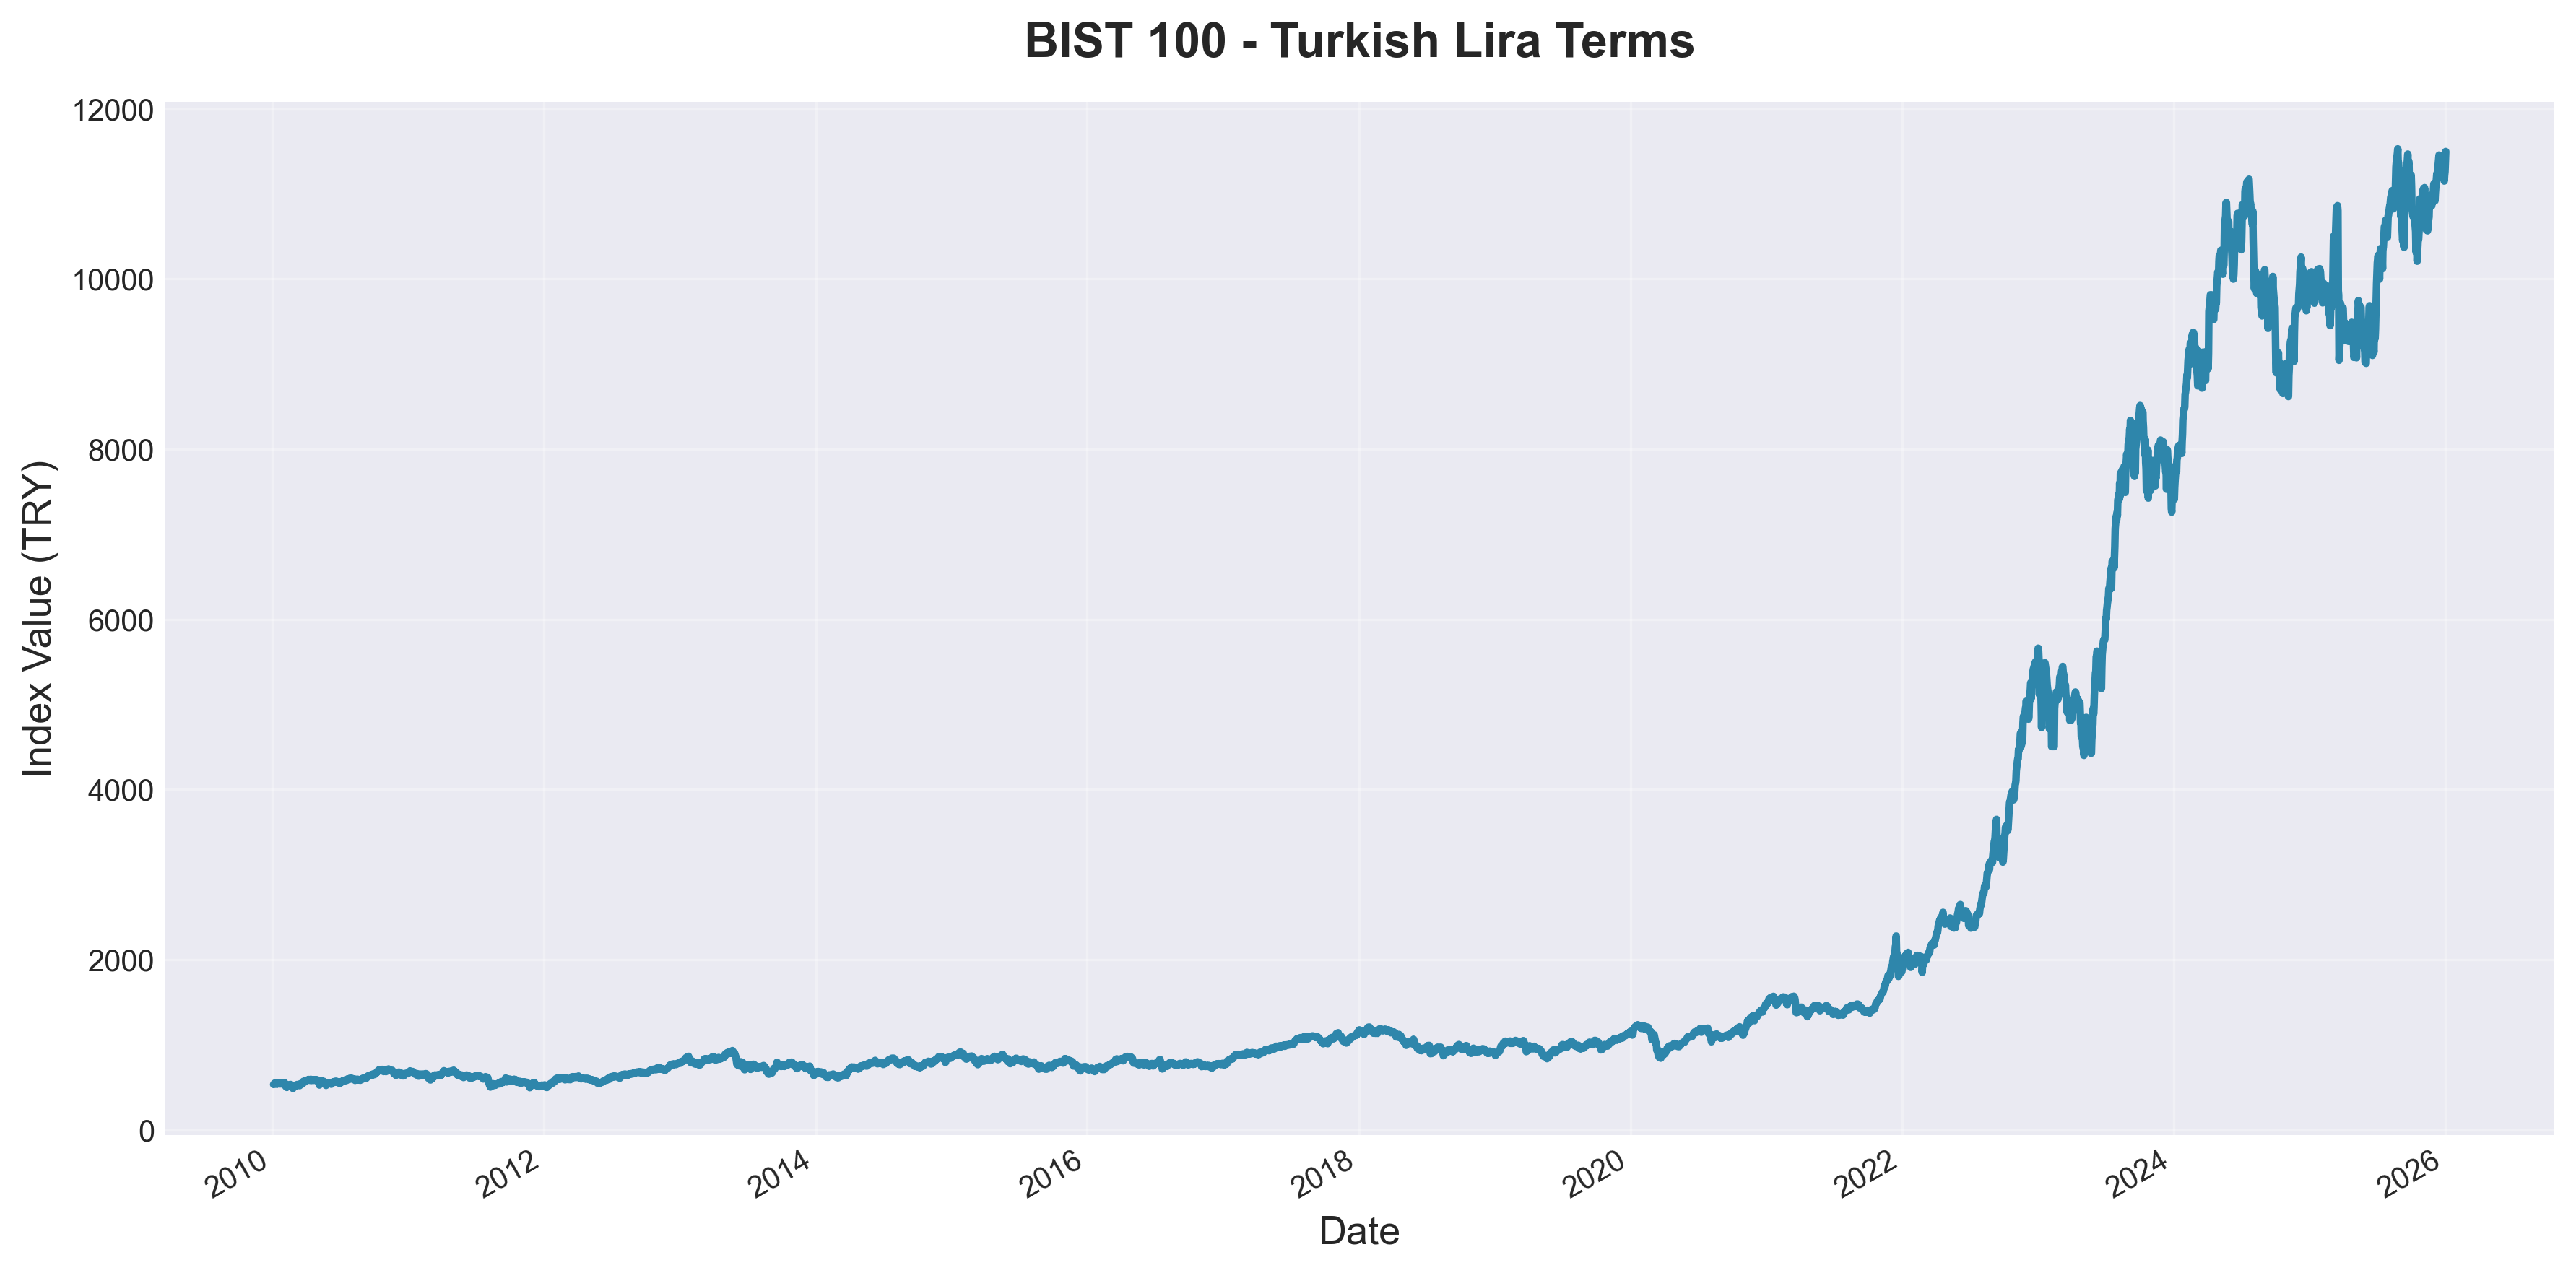
In nominal TRY terms, BIST 100 shows dramatic growth over the 2010-2025 period. The index multiplied roughly 220 times, which appears exceptional by any standard.
This is the view most domestic investors see, and it creates a strong perception of market success. However, this metric alone doesn’t account for two critical factors: currency depreciation and inflation.
Perspective 2: USD-Adjusted Performance
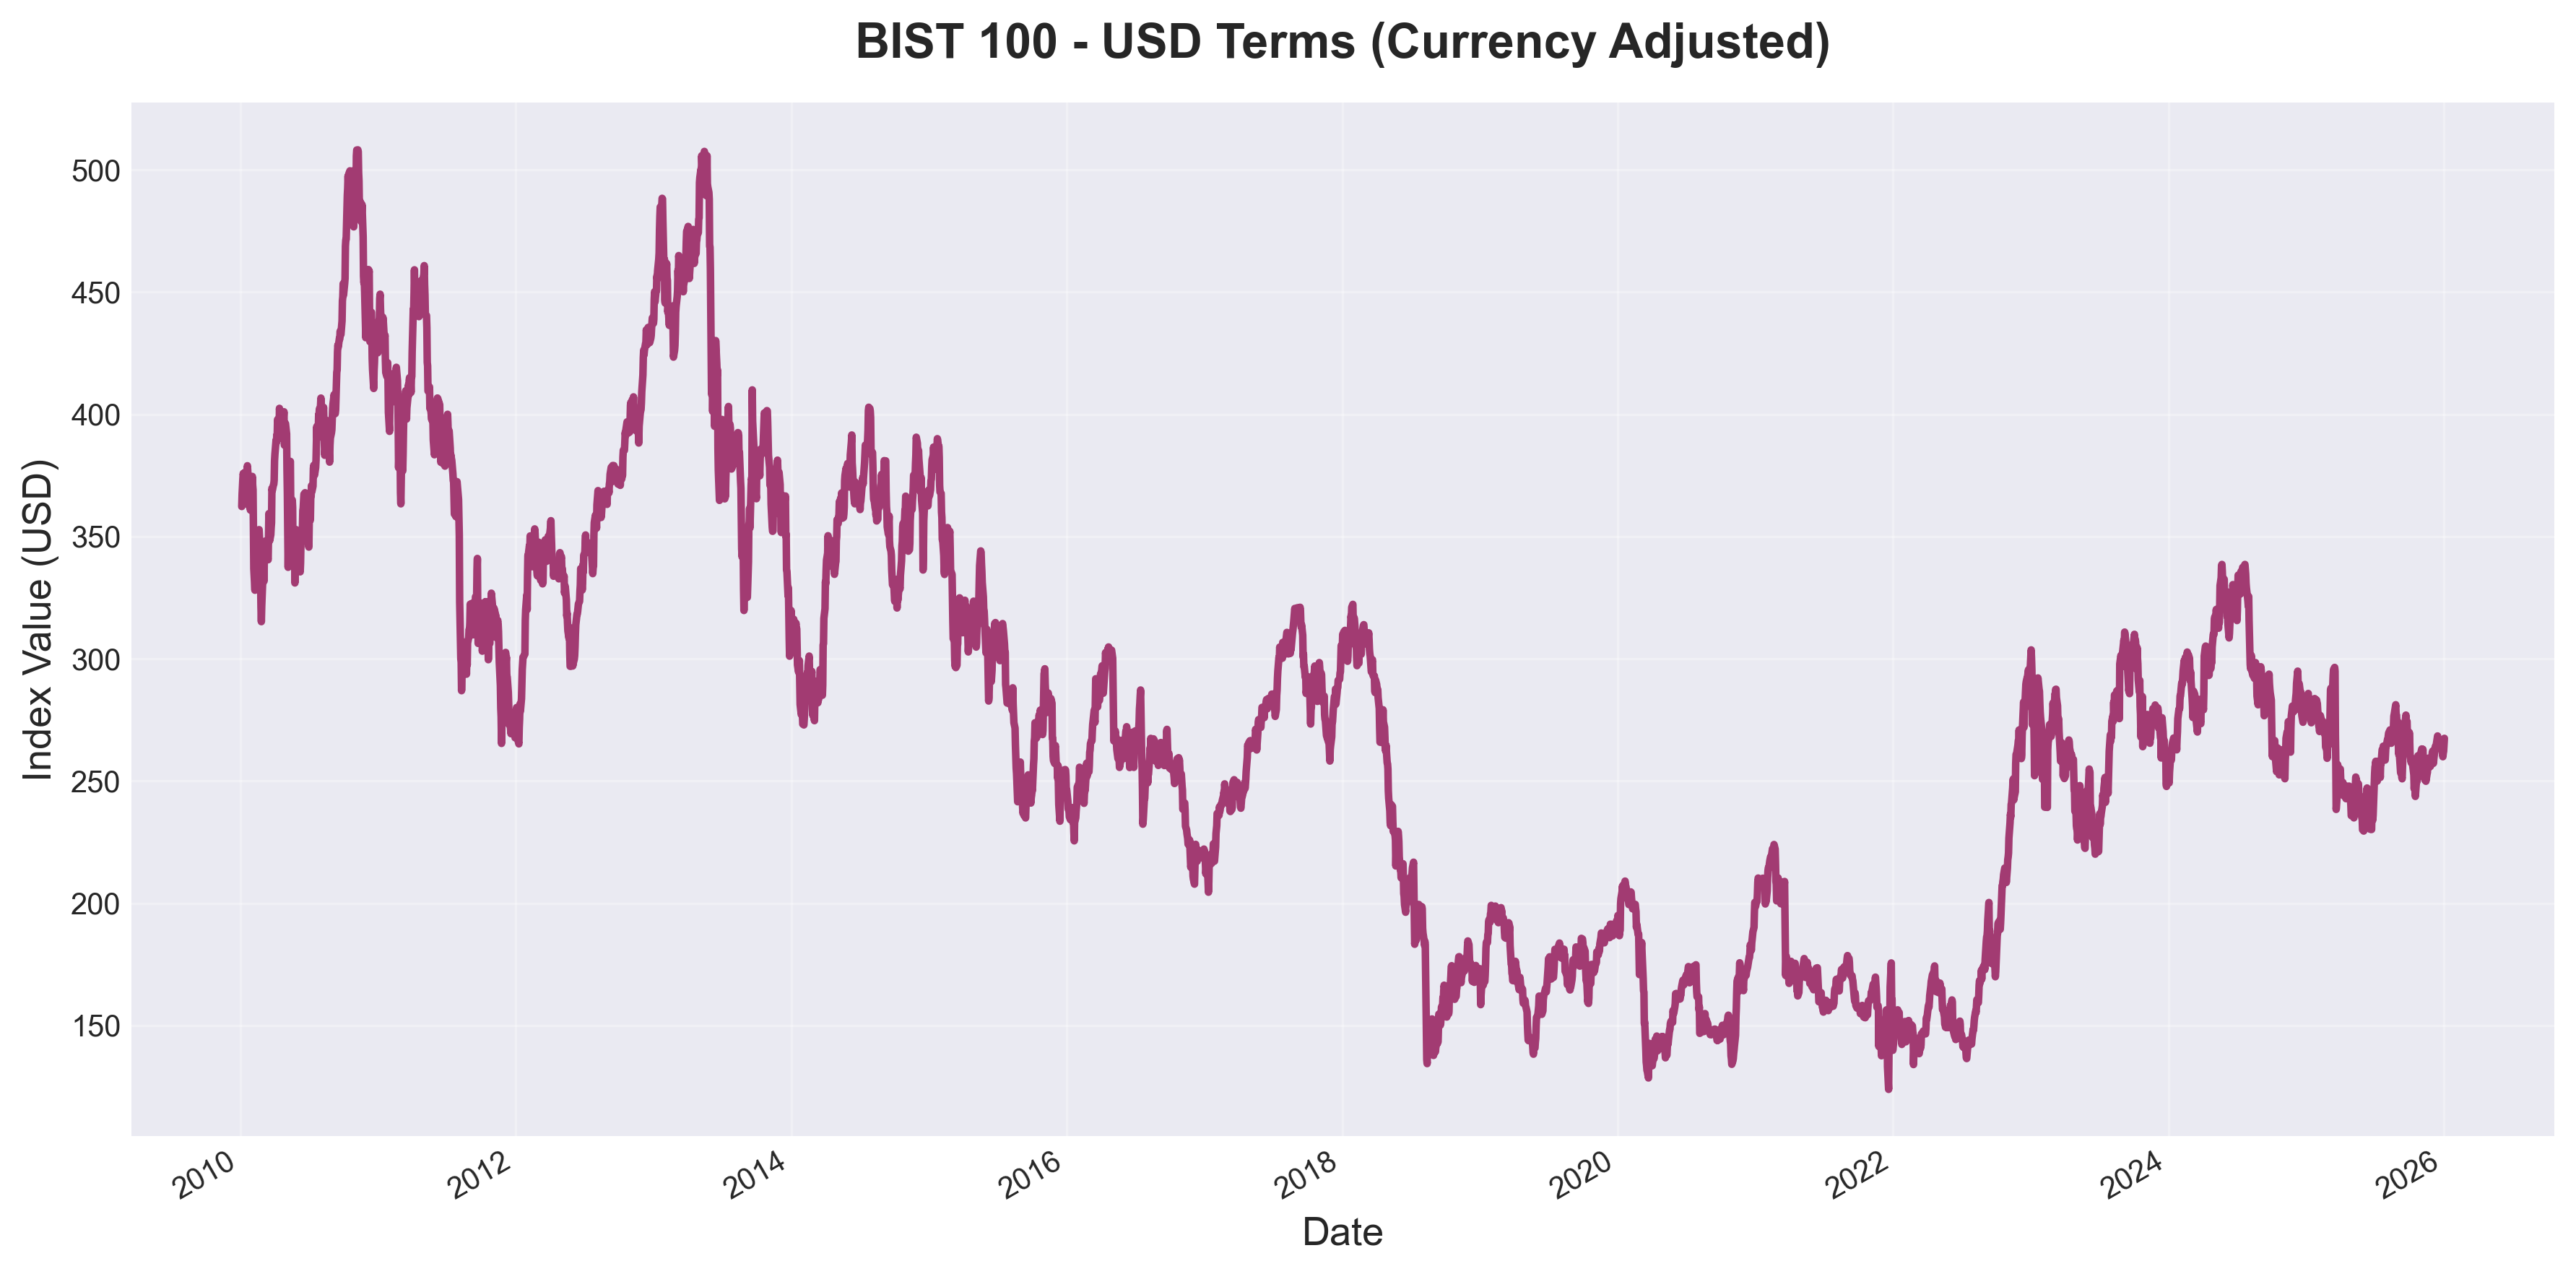
Converting BIST 100 to USD using daily exchange rates reveals a markedly different picture. The index peaked at approximately 450-500 USD in the early 2010s but has declined to around 260 USD as of late 2025.
This represents a 40-48% loss in dollar terms over the period. The massive TRY gains were not only offset by currency depreciation - they were overwhelmed by it. An investor holding BIST 100 throughout this period would have fewer dollars at the end than at the beginning, despite the extraordinary nominal TRY returns.
This matters beyond Turkey’s borders. For international investors, Turkish equities haven’t provided the returns that TRY-denominated charts suggest. For domestic investors planning to purchase imports, travel internationally, or preserve wealth in stable currency terms, the USD-adjusted view is more relevant than nominal TRY performance.
Perspective 3: Real Returns (Inflation-Adjusted)
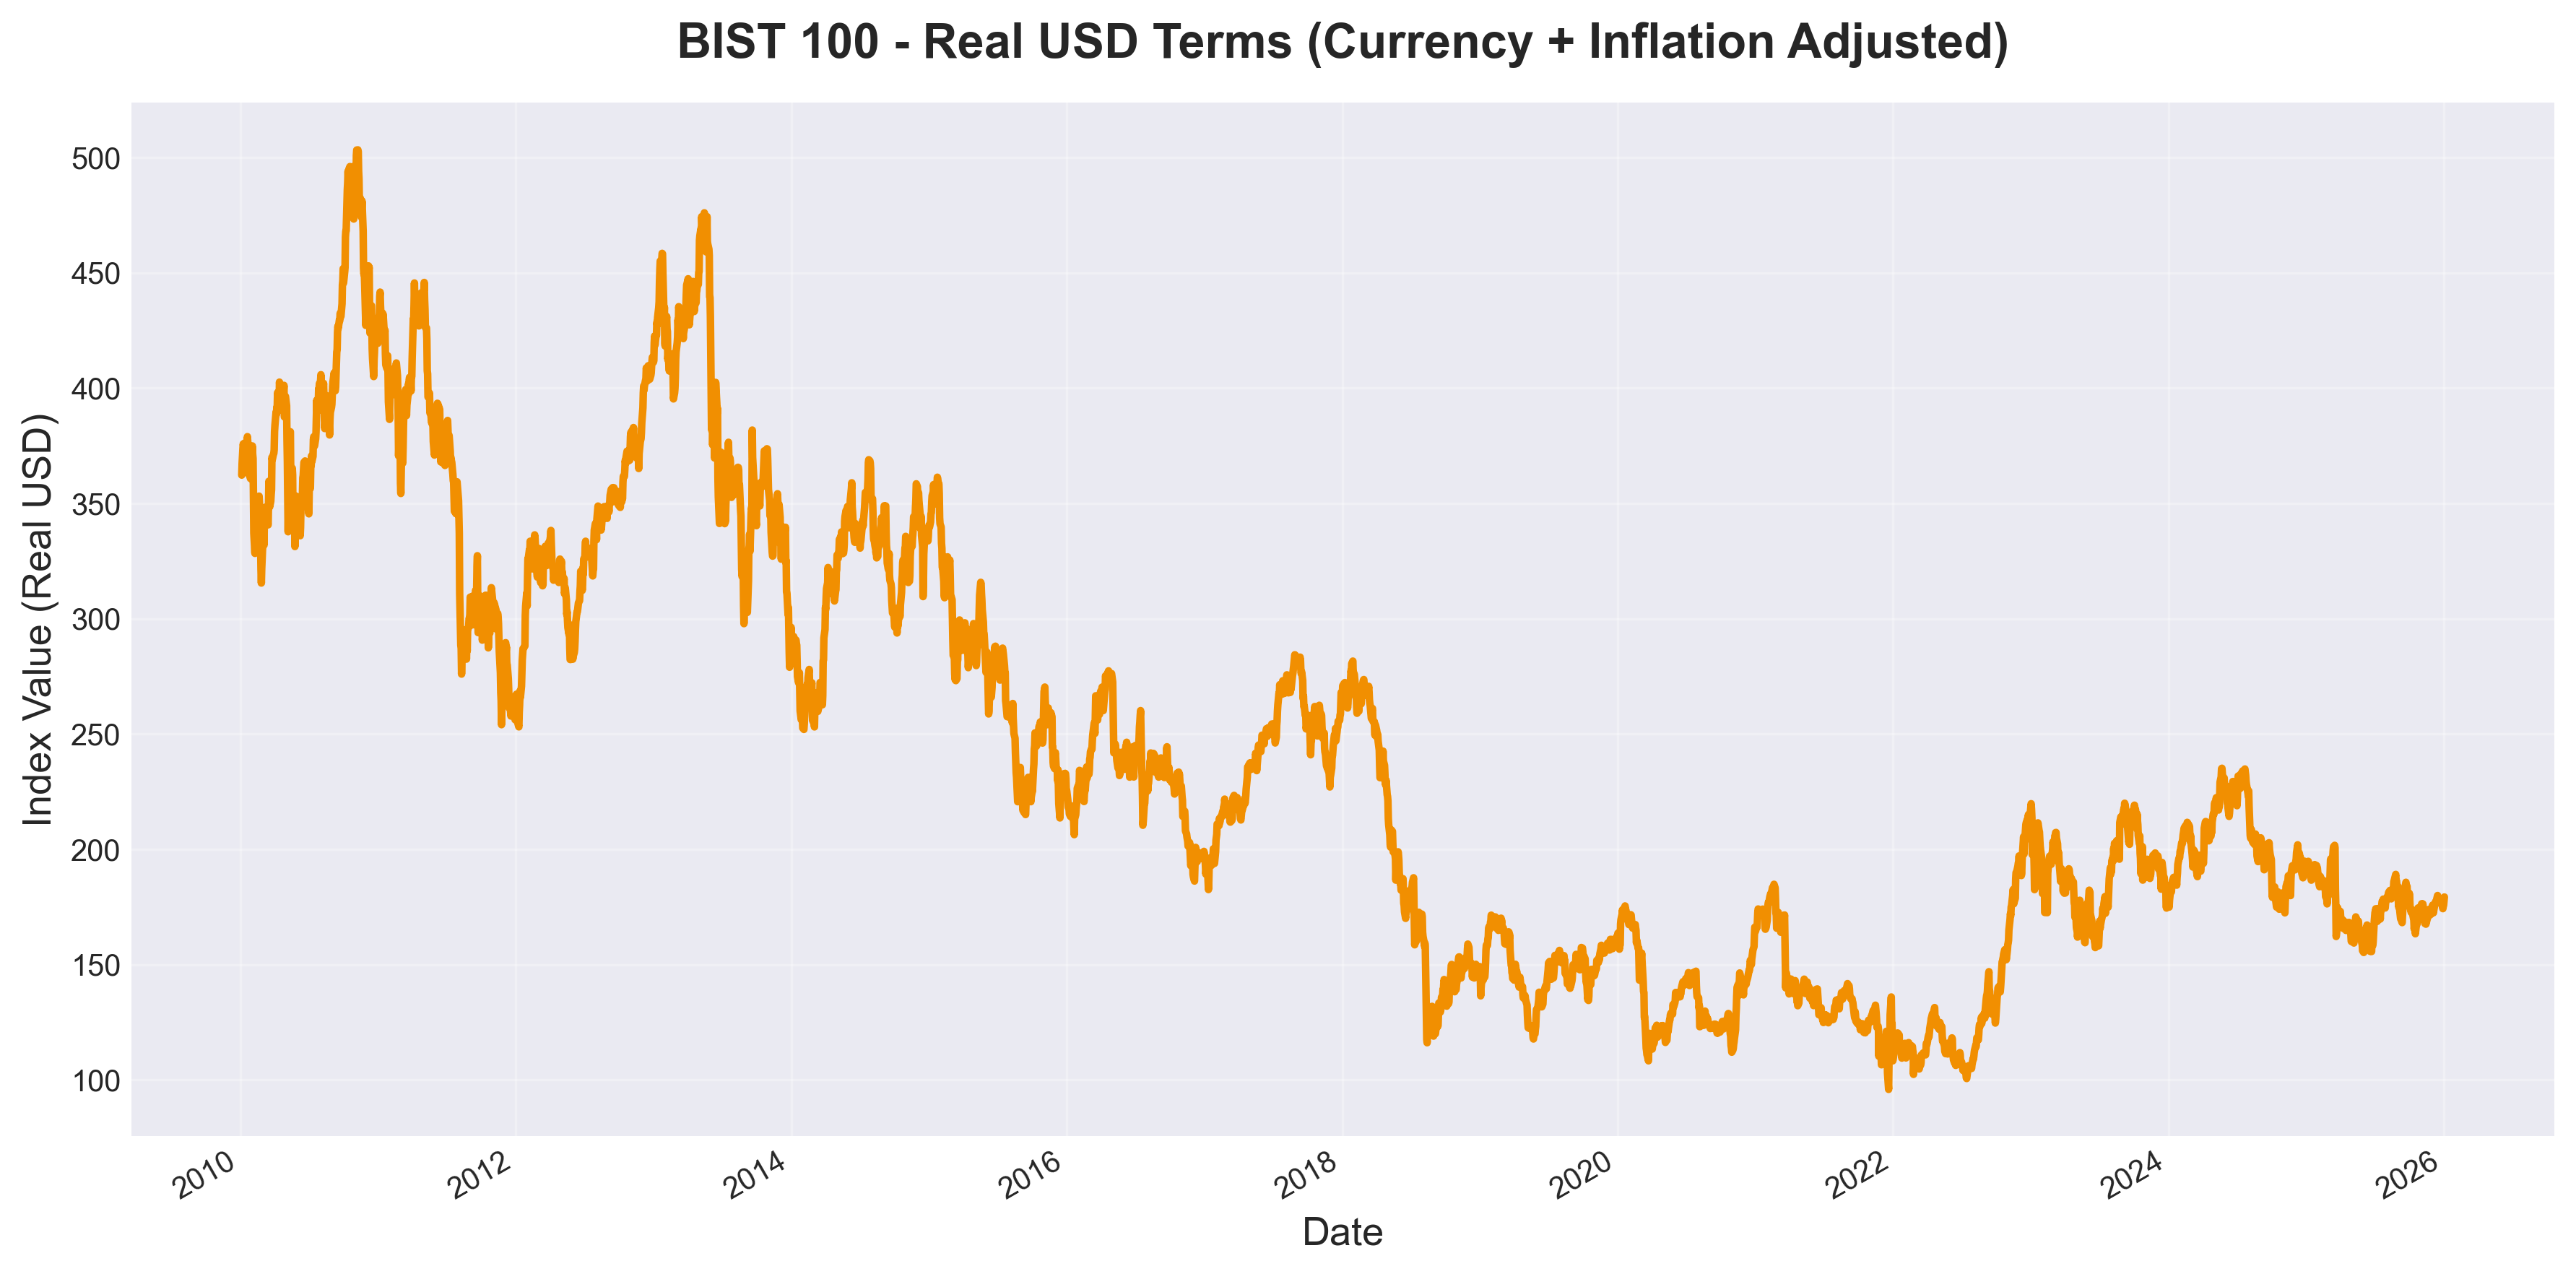
Even stable currencies lose purchasing power over time. The US Consumer Price Index increased approximately 48% from 2010 to 2025 (from 218 to 324). Adjusting for this inflation provides a measure of real purchasing power.
BIST 100 in real USD terms declined from approximately 500 to 180 - a 64% loss in actual purchasing power over the 15-year period.
This is the most sobering metric: despite the index showing massive nominal gains, investors experienced significant wealth destruction in real terms. The value of their holdings, measured in what they can actually purchase, decreased substantially.
Comparative Analysis
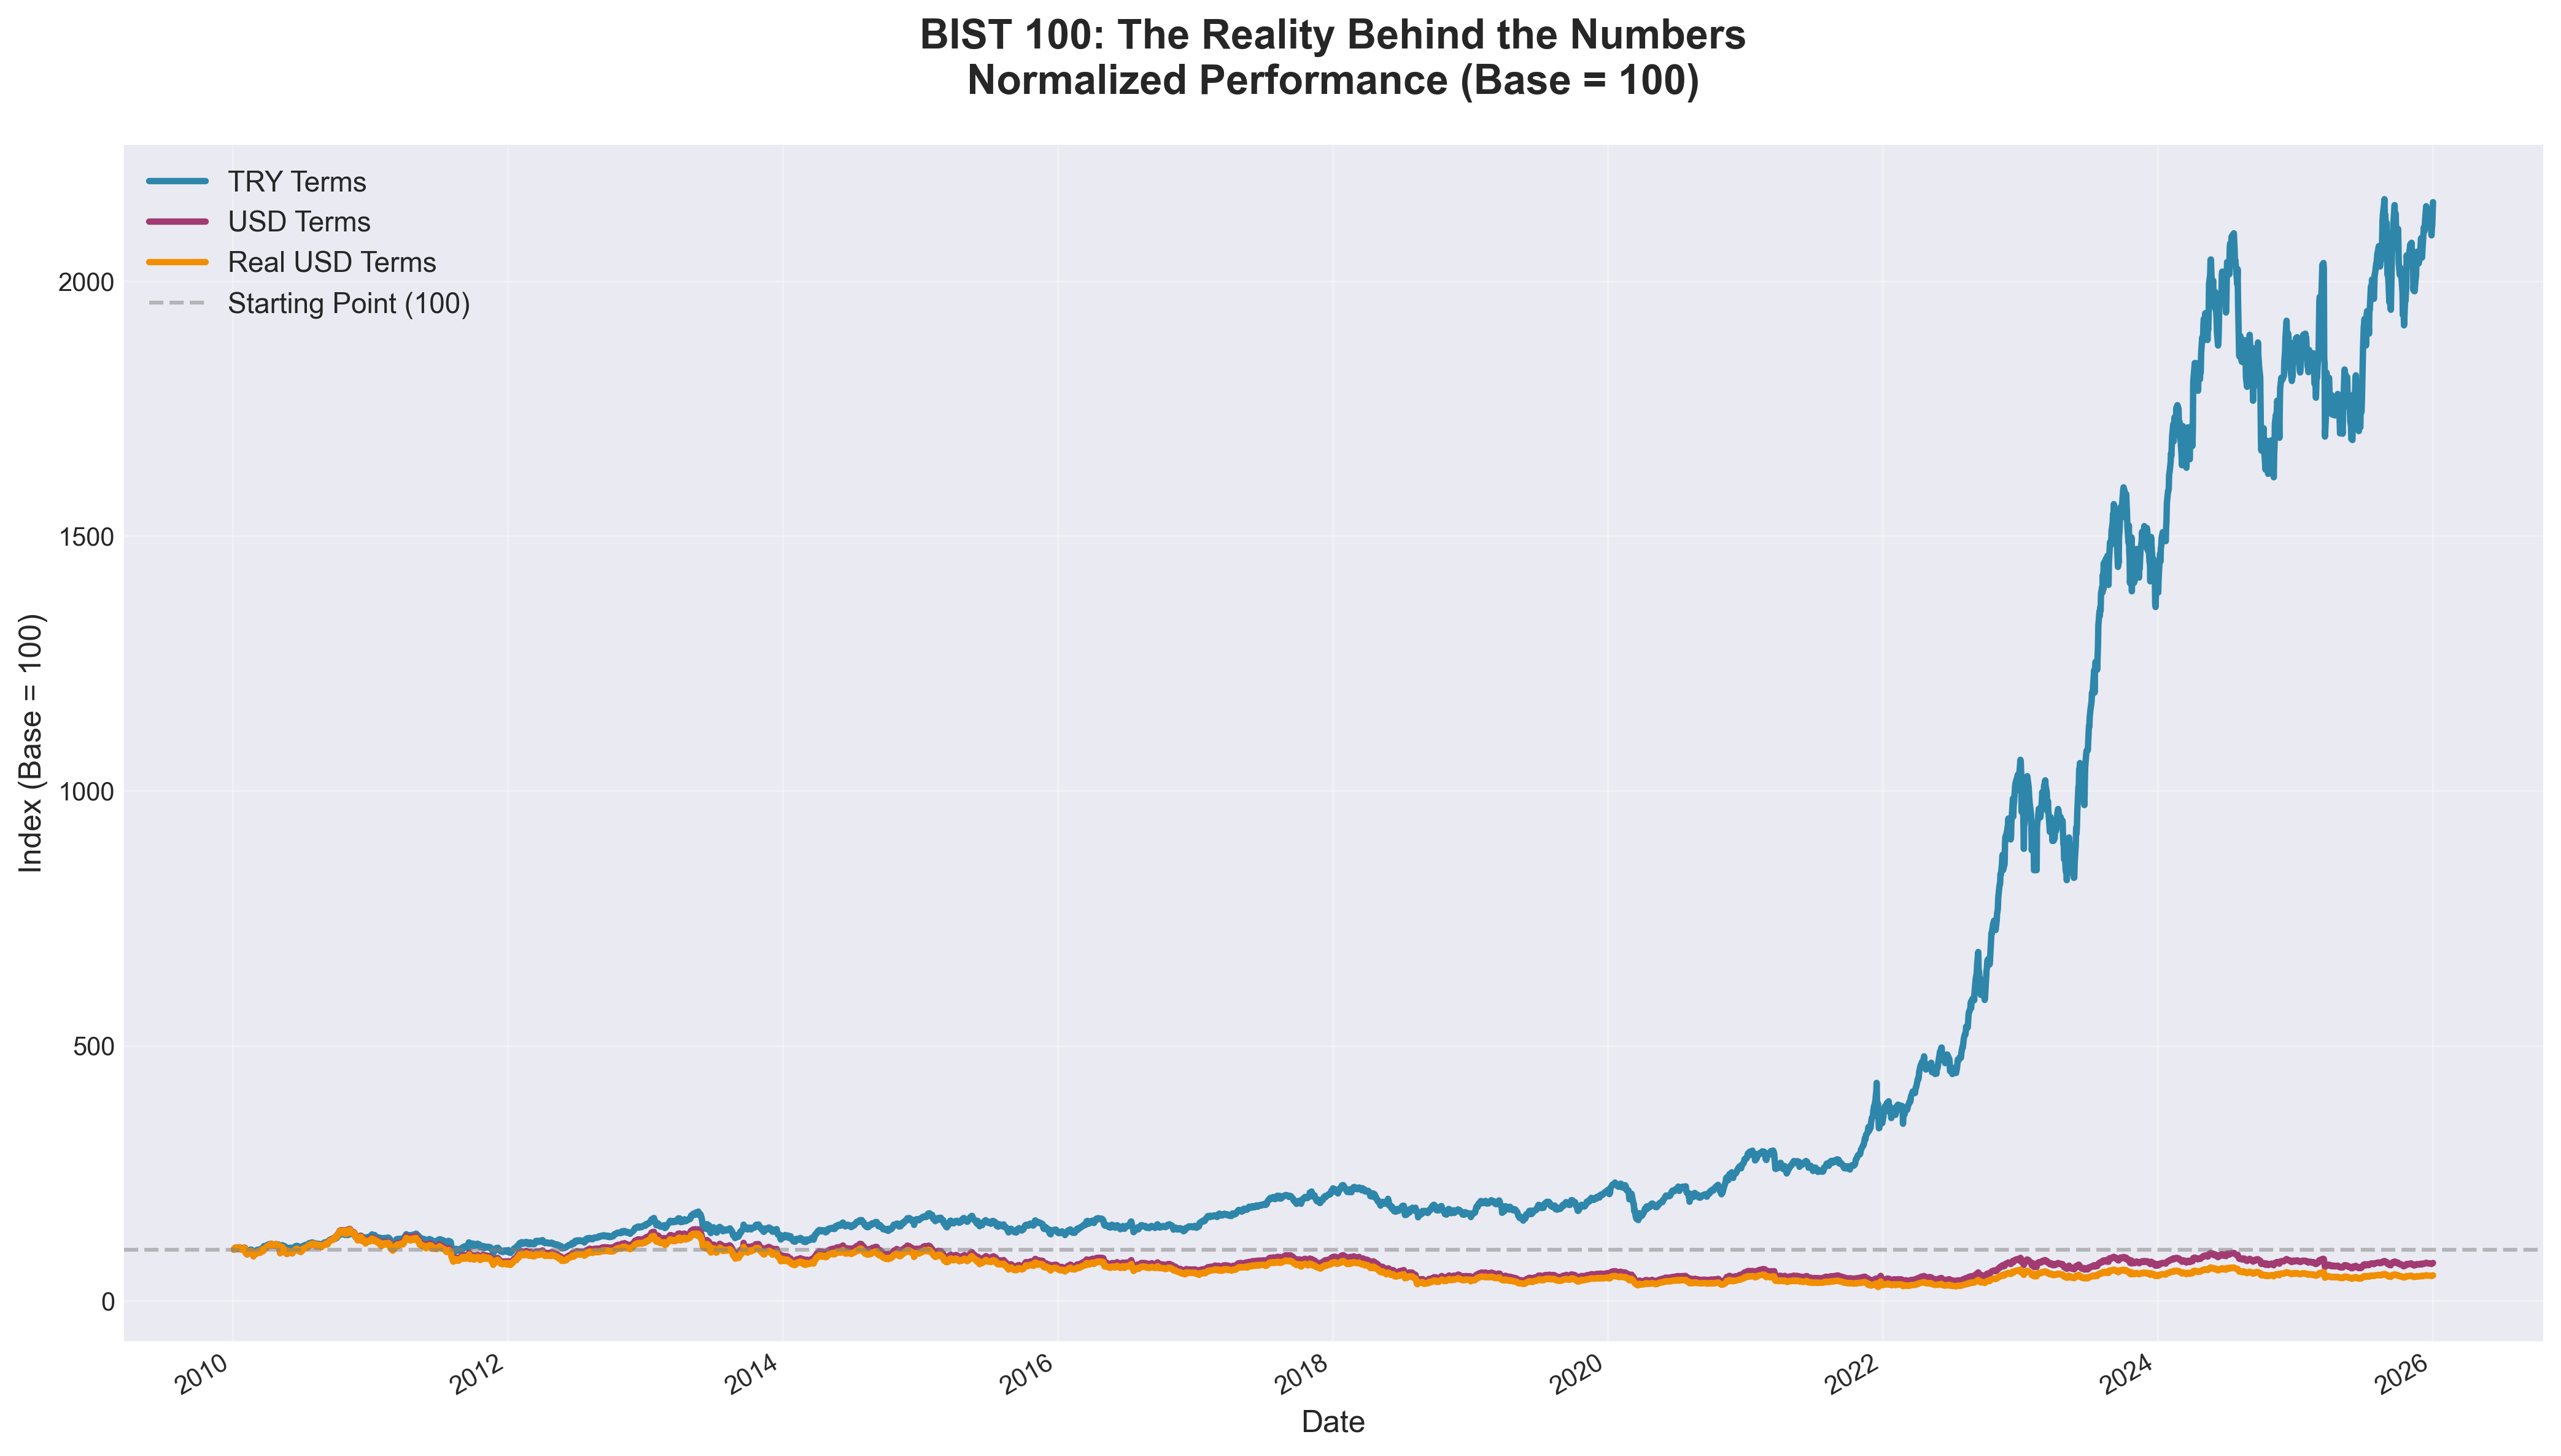
Normalizing all three measures to a base of 100 illustrates the dramatic divergence:
-
TRY Terms: 2,200 (up 2,100%)
-
USD Terms: 58 (down 42%)
-
Real USD Terms: 47 (down 53%)
The same asset, measured three different ways, tells three completely different stories about investment performance.
Index Performance vs. Individual Opportunities
An important distinction: these findings reflect the BIST 100 index as a whole, which represents the average performance across major Turkish equities.
Individual stock selection can yield substantially different results. Companies with:
-
Revenue streams in hard currencies
-
Pricing power that outpaces inflation
-
Rapid real growth in their sectors
-
Strong international operations
…can generate real returns even in challenging macroeconomic environments. However, achieving this requires identifying and holding such companies - a considerably more difficult task than passive index investing, particularly when economic headwinds are strong.
The BIST 100 Total Return index (which includes reinvested dividends) reached approximately 19,000 points by end of 2024, significantly outperforming the price index. Dividends provide some cushion, though they don’t fundamentally alter the currency and inflation dynamics discussed here.
Methodology and Limitations
This analysis used:
-
BIST 100 data from Yahoo Finance (ticker: XU100.IS)
-
USD/TRY exchange rates from Yahoo Finance
-
US CPI data from the FRED API
Calculations:
-
USD-adjusted: BIST_TRY / USDTRY
-
Real returns: USD-adjusted / (CPI_current / CPI_base)
Key limitations:
-
Starting point sensitivity: Beginning the analysis in 2010 (near a peak) versus 2009 (post-crisis trough) significantly affects the outcome
-
Incomplete inflation adjustment: Only US inflation is factored in. Turkish domestic inflation (reaching 80%+ annually in recent years) would present an even more dramatic picture for TRY-based holders
-
Dividends not included: The price index excludes dividend distributions
-
No transaction costs or taxes: Real-world returns would be lower after accounting for trading costs, taxes on gains, and dividend withholding
-
Index averages: Individual stock performance varies widely from the index
Implications
This analysis demonstrates how nominal returns can diverge substantially from real wealth changes in high-inflation, currency-depreciation scenarios.
For investors in emerging markets with volatile currencies, several considerations emerge:
Measurement matters: Nominal returns in local currency can be misleading indicators of actual wealth creation. Real returns in stable currency terms provide a more accurate assessment of purchasing power changes.
Higher bar for success: In stable currency environments, beating the market index is the standard for active management. In depreciating currency environments, investors must generate returns that exceed both market performance AND currency depreciation just to preserve real wealth. This substantially raises the difficulty of successful investing.
Currency risk is not just volatility: Currency depreciation acts as a persistent headwind that compounds over time. It’s not symmetric - recovery from depreciation requires much larger percentage gains.
Index limitations: Passive index investing, while effective in many markets, faces particular challenges in environments with structural currency weakness. Active selection becomes more important but also more difficult.
None of this renders emerging market equities uninvestable. However, it does require adjusting expectations and measurement frameworks. A strategy that “only” breaks even in real purchasing power terms represents a significant achievement in certain economic contexts.
Analysis code and complete dataset available on GitHub. Built using Python with yfinance, pandas, matplotlib, and the FRED API.
Data through January 2025. This is analytical commentary, not investment advice