Japan’s government owes more than 250% of its GDP—imagine earning $100,000 but owing $250,000. For most countries, this triggers crisis. Yet Japan functions normally, its bonds remain stable, and interest rates hover near zero.
How does a major economy sustain such massive debt without collapse? The answer reveals crucial lessons about monetary policy limits, the psychology of debt crises, and why cheap money doesn’t always work.
Data note: Debt figures run through 2023 (latest annual data); currency and interest rates extend to 2025.
Understanding Debt-to-GDP
The debt-to-GDP ratio compares what a government owes against its annual economic output. It’s like comparing your mortgage to your yearly salary.
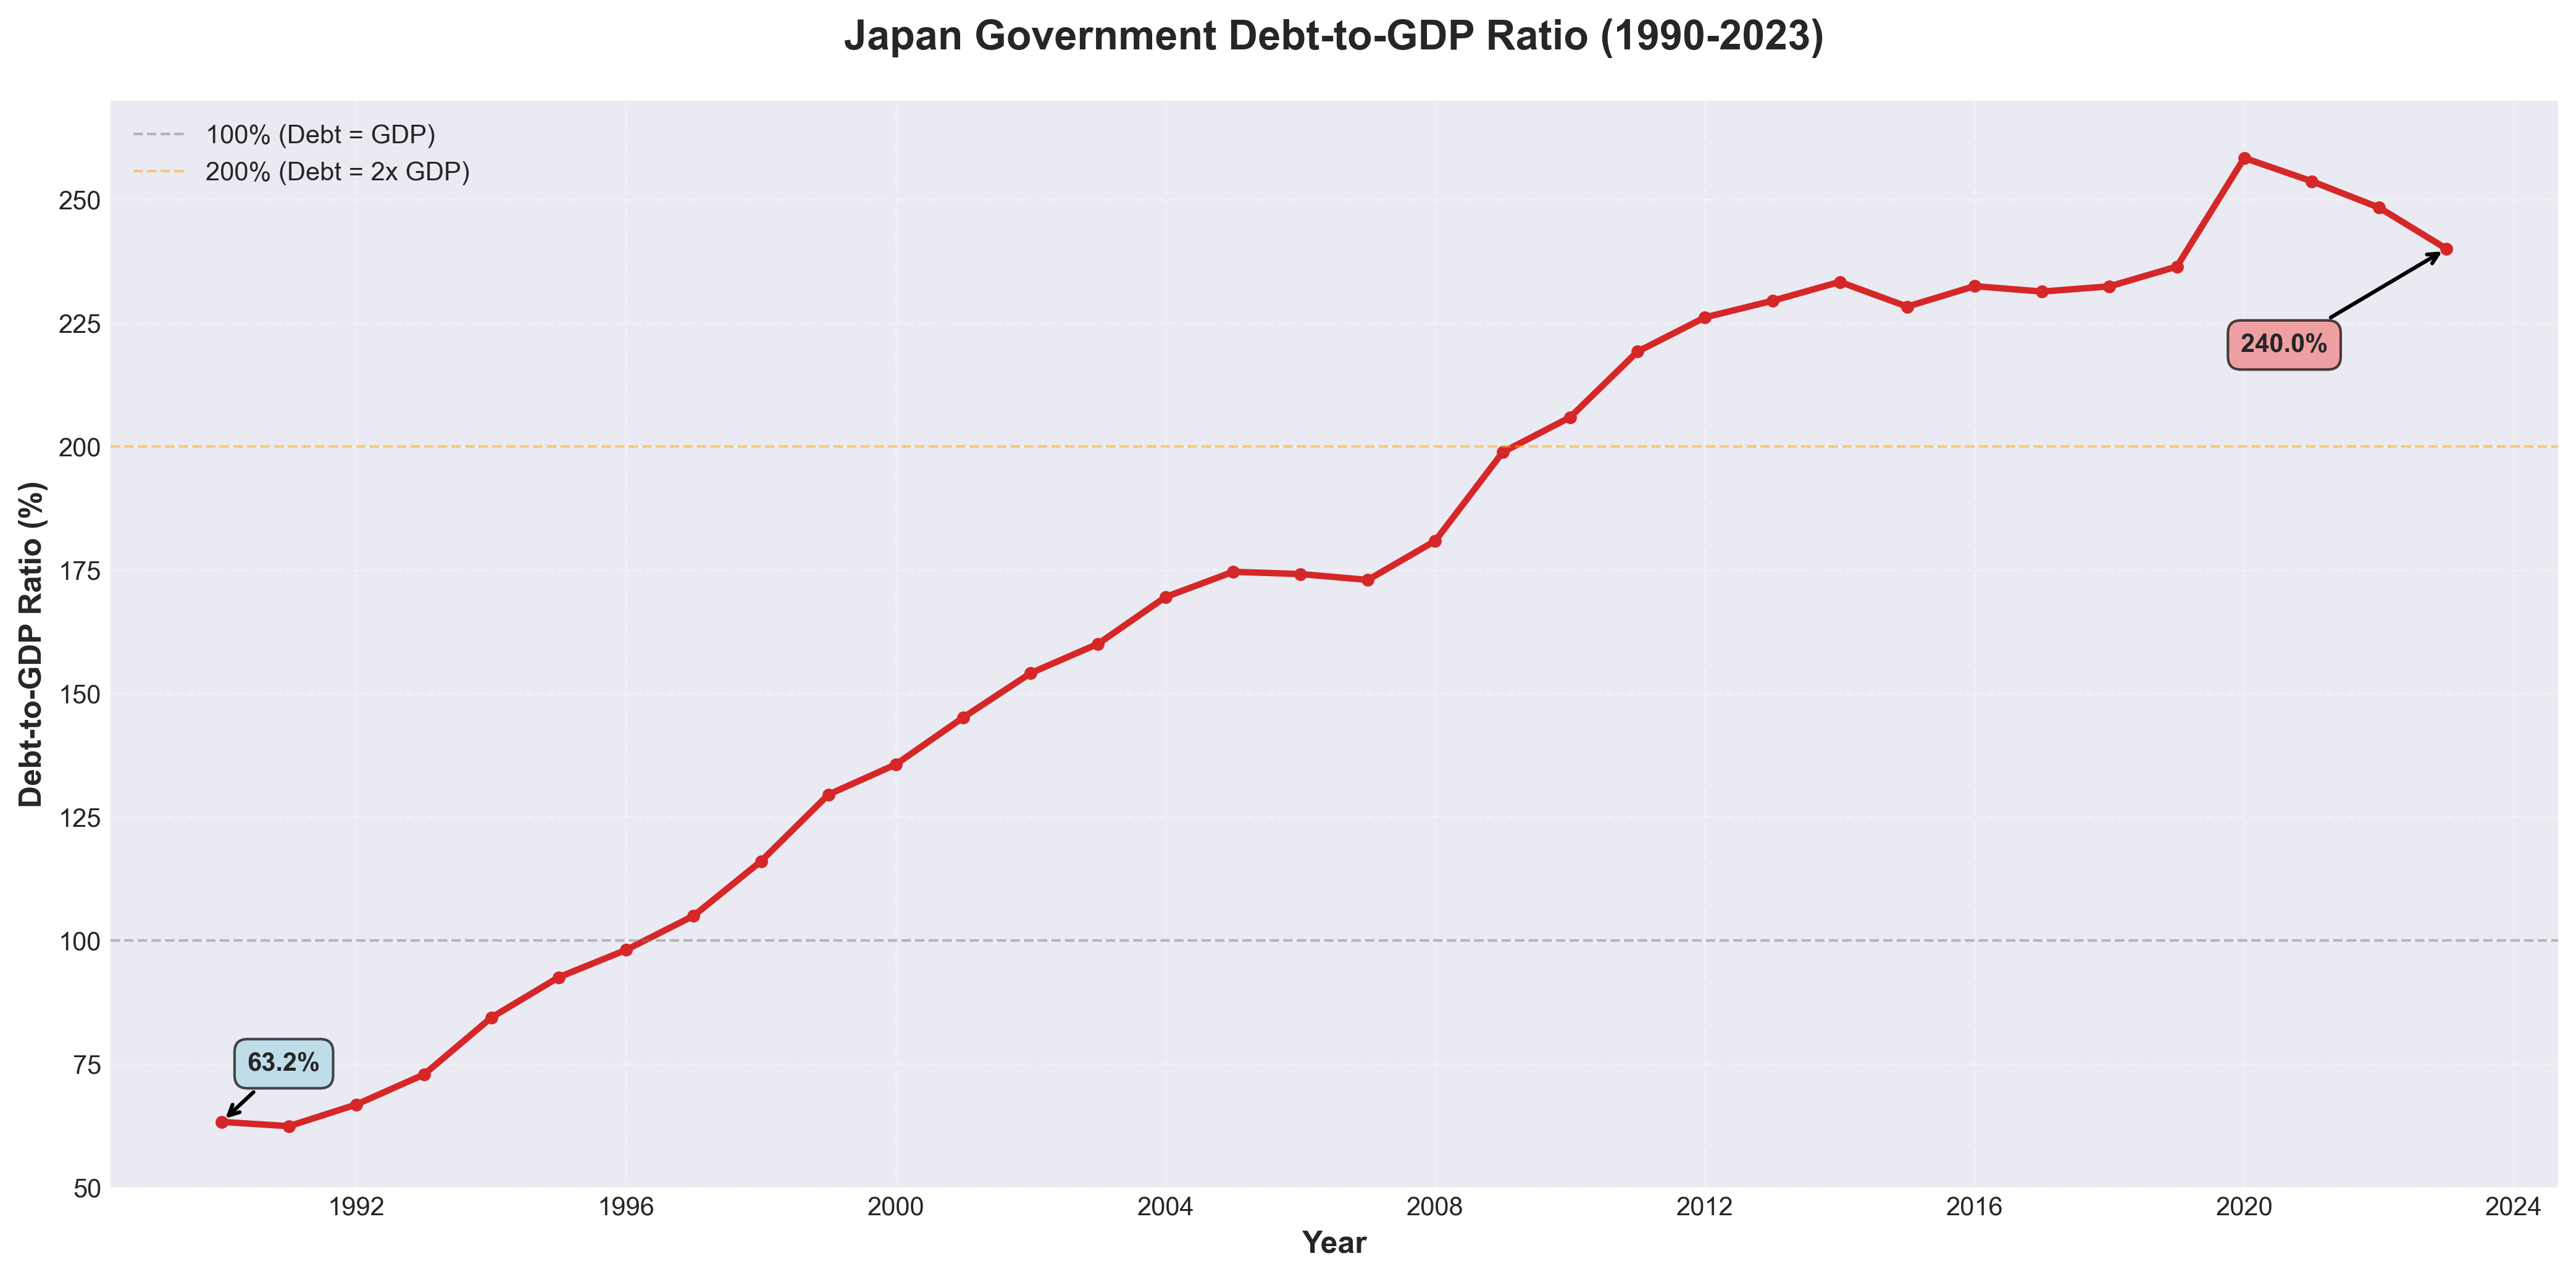
Economists traditionally worried at 60-90% debt-to-GDP. At 100%, your debt equals an entire year’s output. Japan sits at 240%—more than double what’s considered sustainable.
High debt creates three problems: it consumes revenue through interest payments, limits crisis response flexibility, and can undermine currency confidence.
Chart 1 shows Japan’s trajectory: start
ing at a manageable 63% in 1990, crossing 100% by the late 1990s, and hitting 240% by 2023. A near-quadrupling in 33 years with no meaningful reversals.
What happened?
The Zero-Rate Trap
Japan’s 1990s asset bubble burst spectacularly. Property values crashed 70-80%, banks teetered on collapse, and the economy stalled. The Bank of Japan’s solution? Cut interest rates from 6% toward zero.
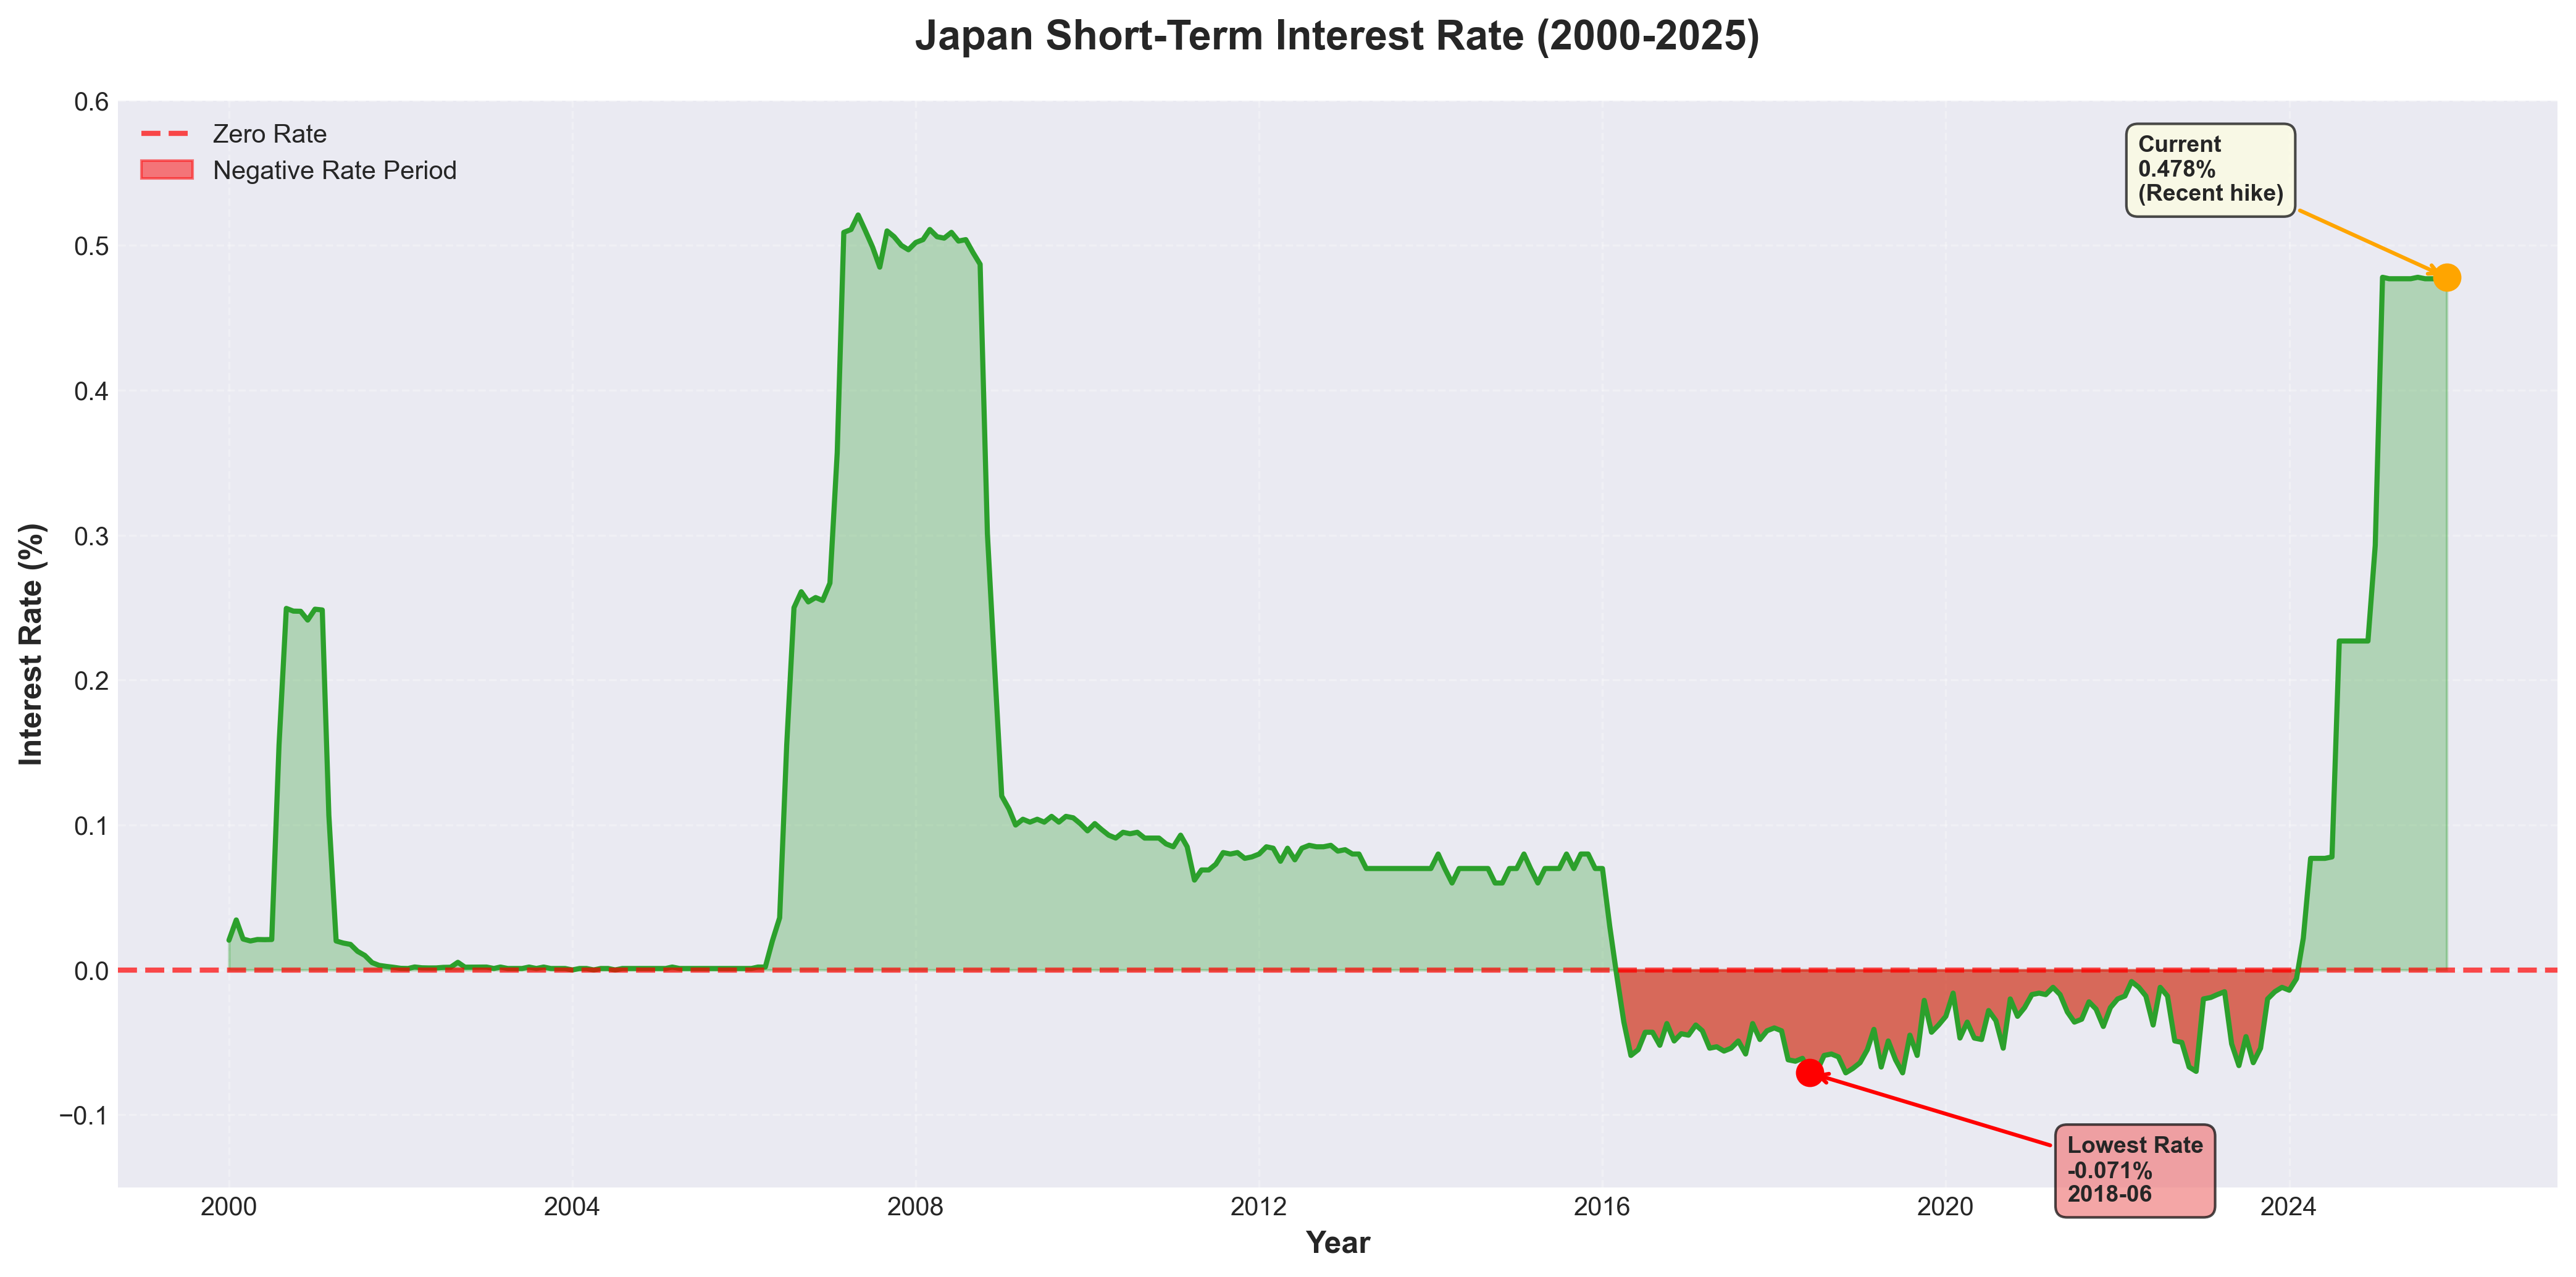
Chart 3 reveals the strategy: rates stayed below 0.1% for most of 25 years. From 2016-2024, Japan even tried negative rates—banks paid to hold money rather than earning interest. Only in 2024 did rates creep back to 0.5%.
The theory made sense: free money should encourage borrowing and spending. But Japan discovered monetary policy’s limits. Businesses and households, burned by the crash, prioritized savings over spending despite rock-bottom rates. Economists call this a liquidity trap—lowering rates further doesn’t change behavior.
Think about it: a retiree with $100,000 earns $5,000 yearly at 5% rates but only $50 at Japan’s near-zero rates. Banks can’t profit charging 0.1% on loans. The financial system itself weakens.
Meanwhile, ultra-low rates had another effect: currency collapse.
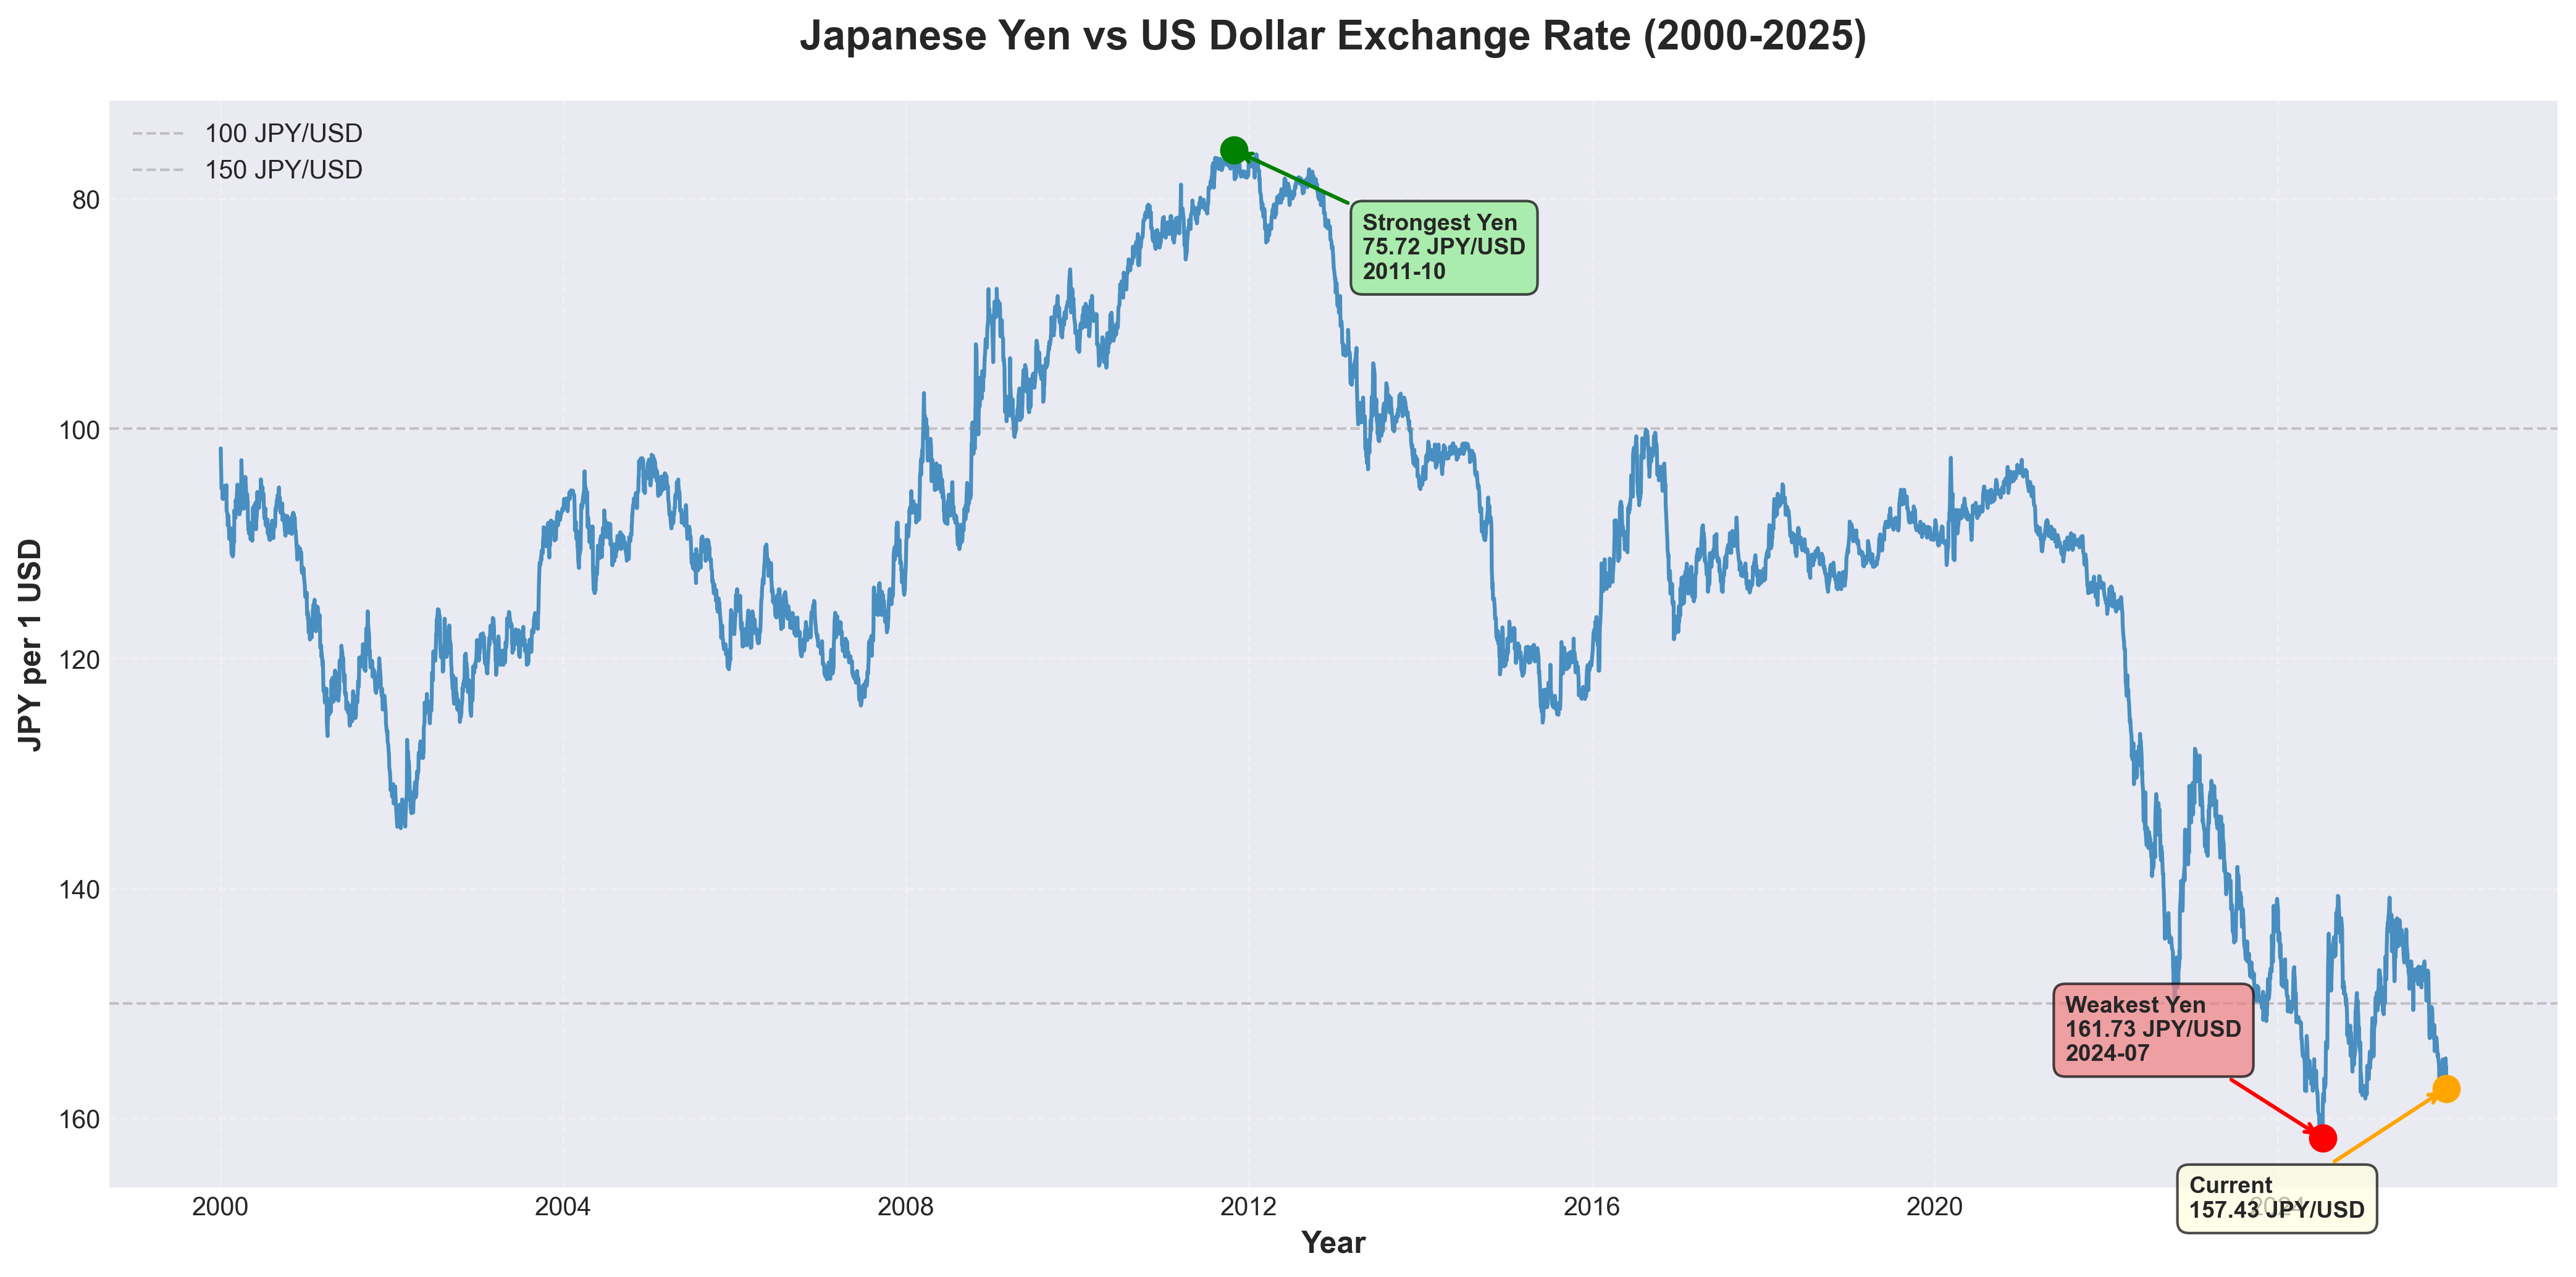
Chart 2 shows the yen’s decline: from 102 per dollar in 2000 to 157 today—55% depreciation. The yen hit its strongest at 75.72 in 2011 (post-tsunami safe-haven flows) before steadily weakening, accelerating after 2020 when other countries raised rates while Japan stayed at zero. It bottomed at 161.73 in July 2024.
Weaker yen helps exporters but hammers import costs and erodes citizens’ purchasing power.
The vicious cycle: Low rates made borrowing costless, removing fiscal discipline. Slow growth meant weak tax revenues. Solution? More borrowing. Result? The debt spiral in Chart 1.
What Now?
Japan’s betting on gradual erosion—modest growth slowly improving the debt-to-GDP ratio over decades. Recent rate hikes to 0.5% suggest confidence the economy can handle slightly higher costs.
But there’s a catch: with ¥1,330 trillion in debt, every 1% rate increase adds ¥13 trillion in annual interest payments. This arithmetic constrains how much Japan can normalize policy.
Structural reforms and controlled inflation offer alternative paths, but both require political will that’s proven elusive. Japan’s stability buys time—whether it leads to resolution or just postpones harder choices remains unclear.
Closing
Japan’s three-decade experiment shows how developed economies can sustain supposedly unsustainable debt levels—and the limits of trying to print your way to prosperity.