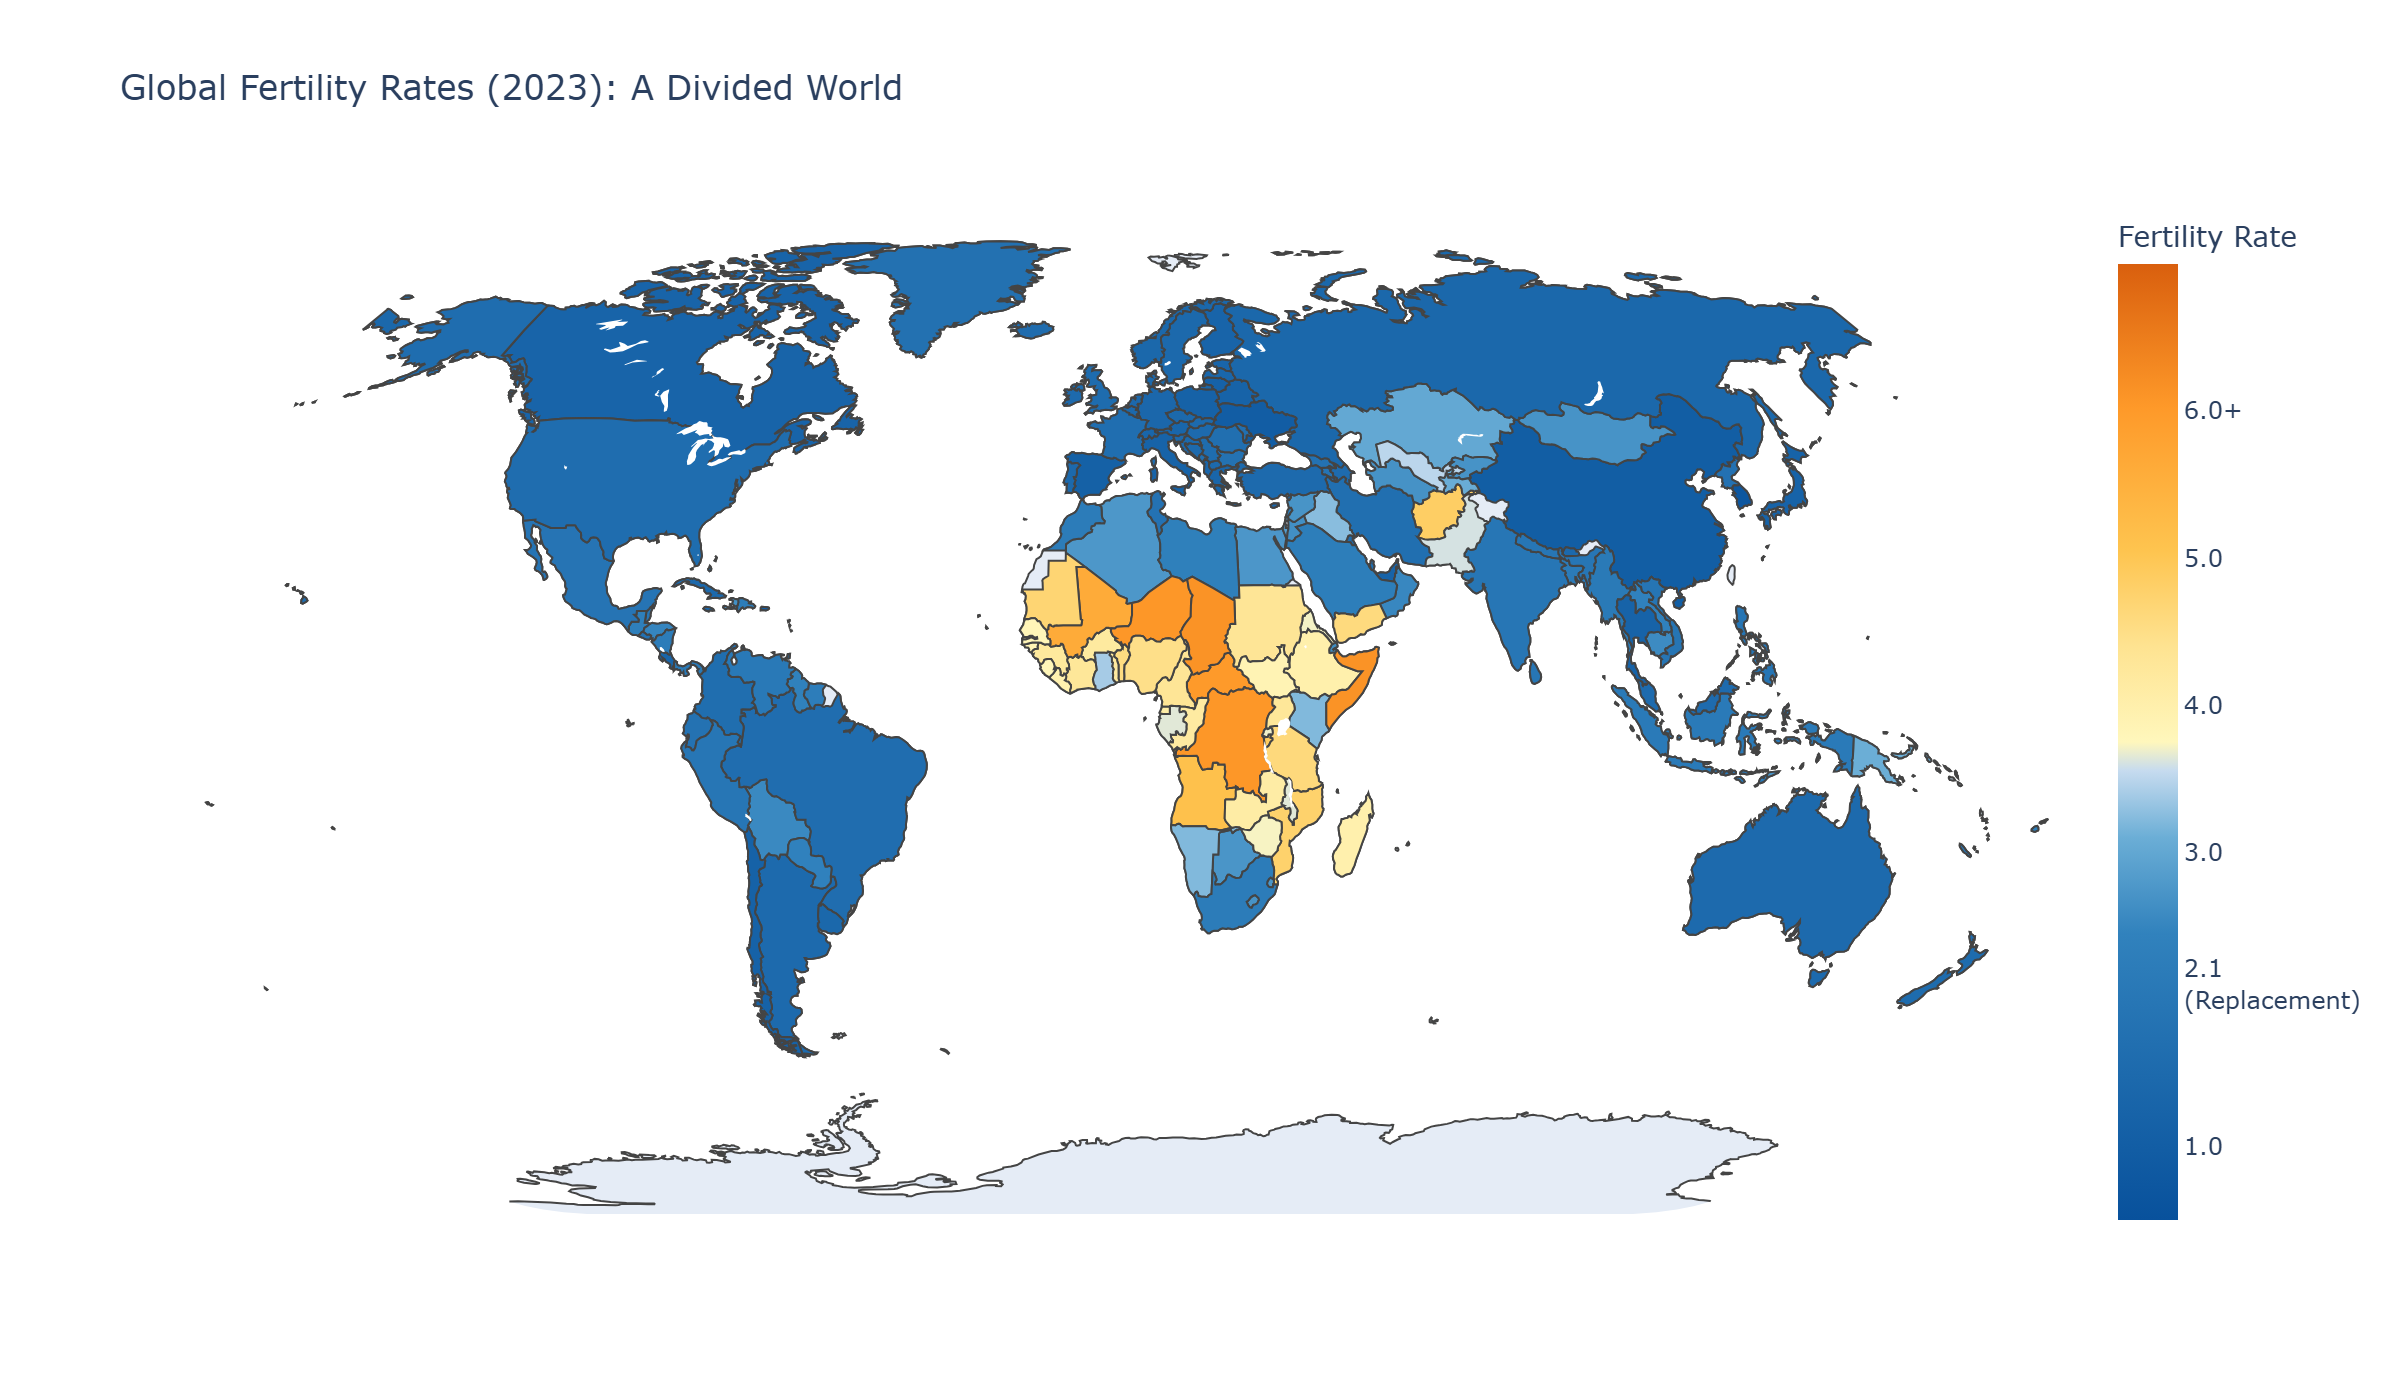
Look at this map. The red zones—most of Africa—tell one story: Niger at 6.7 children per woman, Somalia at 6.1. These countries are still growing rapidly. The global population hit 8.2 billion in 2024 and keeps climbing, largely driven by these regions.
But that’s not what this article is about.
This is about the blue zones. The countries where something unprecedented is happening. Where governments are spending hundreds of billions trying to convince their citizens to have children—and failing spectacularly.
The Threshold That Changes Everything
First, let’s establish a number: 2.1
This is called the “replacement level fertility rate,” or TFR (Total Fertility Rate). It’s the average number of children each woman needs to have for a population to stay stable. Why 2.1 and not 2.0? Because not all children survive to adulthood, and slightly more boys are born than girls.
Above 2.1: your population grows. Below 2.1: your population shrinks.
Simple math. Irreversible consequences.
When I analyzed World Bank data spanning from 1960 to 2024 covering 266 countries, I discovered something unsettling: 63 countries have already peaked in population size. They’ve crossed the threshold and they’re not coming back.
Once You Cross, You Don’t Return
I built a PostgreSQL database to track exactly when countries first dropped below 2.1. The results were striking.
Czechia dropped below replacement level in 1960—64 years ago. It’s been below ever since, currently sitting at 1.45.
Serbia: 1963. That’s 61 years below replacement. Japan: 1964. Sixty years and counting. Germany: 1970. Fifty-four years.
Here’s what none of these countries have in common: recovery. Not one has climbed back above 2.1 and stayed there.
The Real Crisis: Who Pays for Grandma?
Low birth rates wouldn’t matter much if populations stayed young forever. But they don’t. This is where the “old-age dependency ratio” comes in—a metric that should terrify any finance minister.
The formula is simple: (Population 65+ / Population 15-64) × 100
Translation: How many retirees does each group of 100 working-age people need to support?
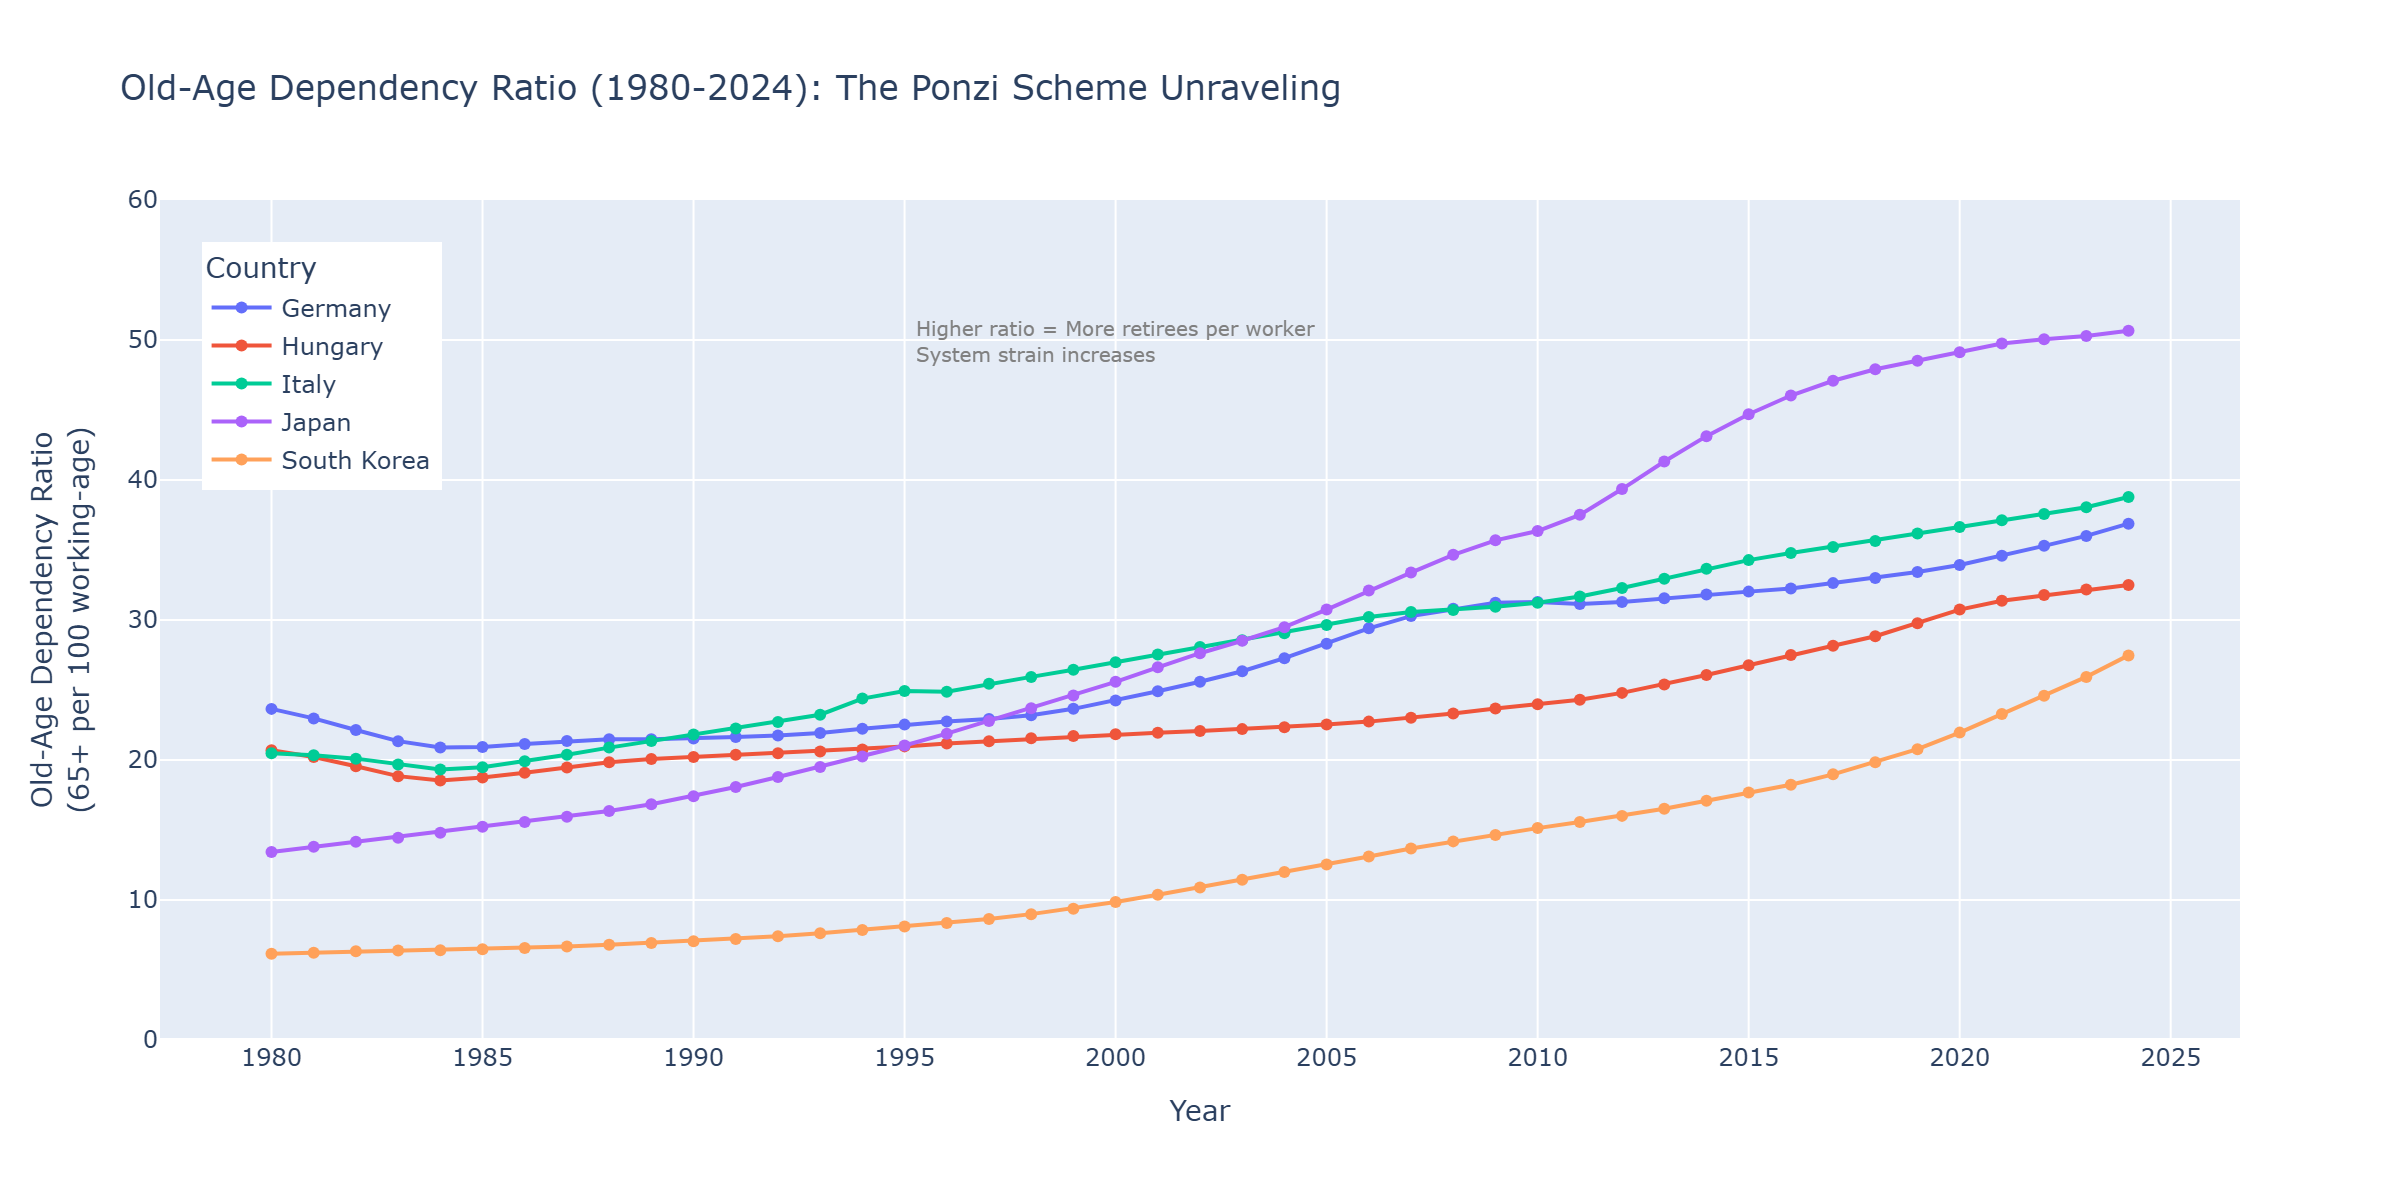
Look at Japan’s line on this chart. In 1980, the ratio was around 14—every 100 workers supported 14 retirees. By 2024, it hit 51. Every 100 workers now support 51 retirees.
The pension system was designed as a pyramid: many young workers at the bottom, few retirees at the top. Japan’s pyramid has inverted. It’s a Ponzi scheme running in reverse.
But here’s what caught my attention in the analysis: South Korea’s trajectory.
Korea started at 7.05 in 1990. Today it’s at 27.47. That’s a 290% increase in 34 years. When I calculated the growth rates, Korea’s ratio is accelerating faster than any other country. Thailand is second at 268% growth, Japan third at 191%.
If these trends continue—and there’s no reason to think they won’t—South Korea will surpass Japan’s dependency ratio by 2035.
South Korea: When $211 Billion Buys Nothing
Now let’s talk about the country with the lowest fertility rate on Earth.
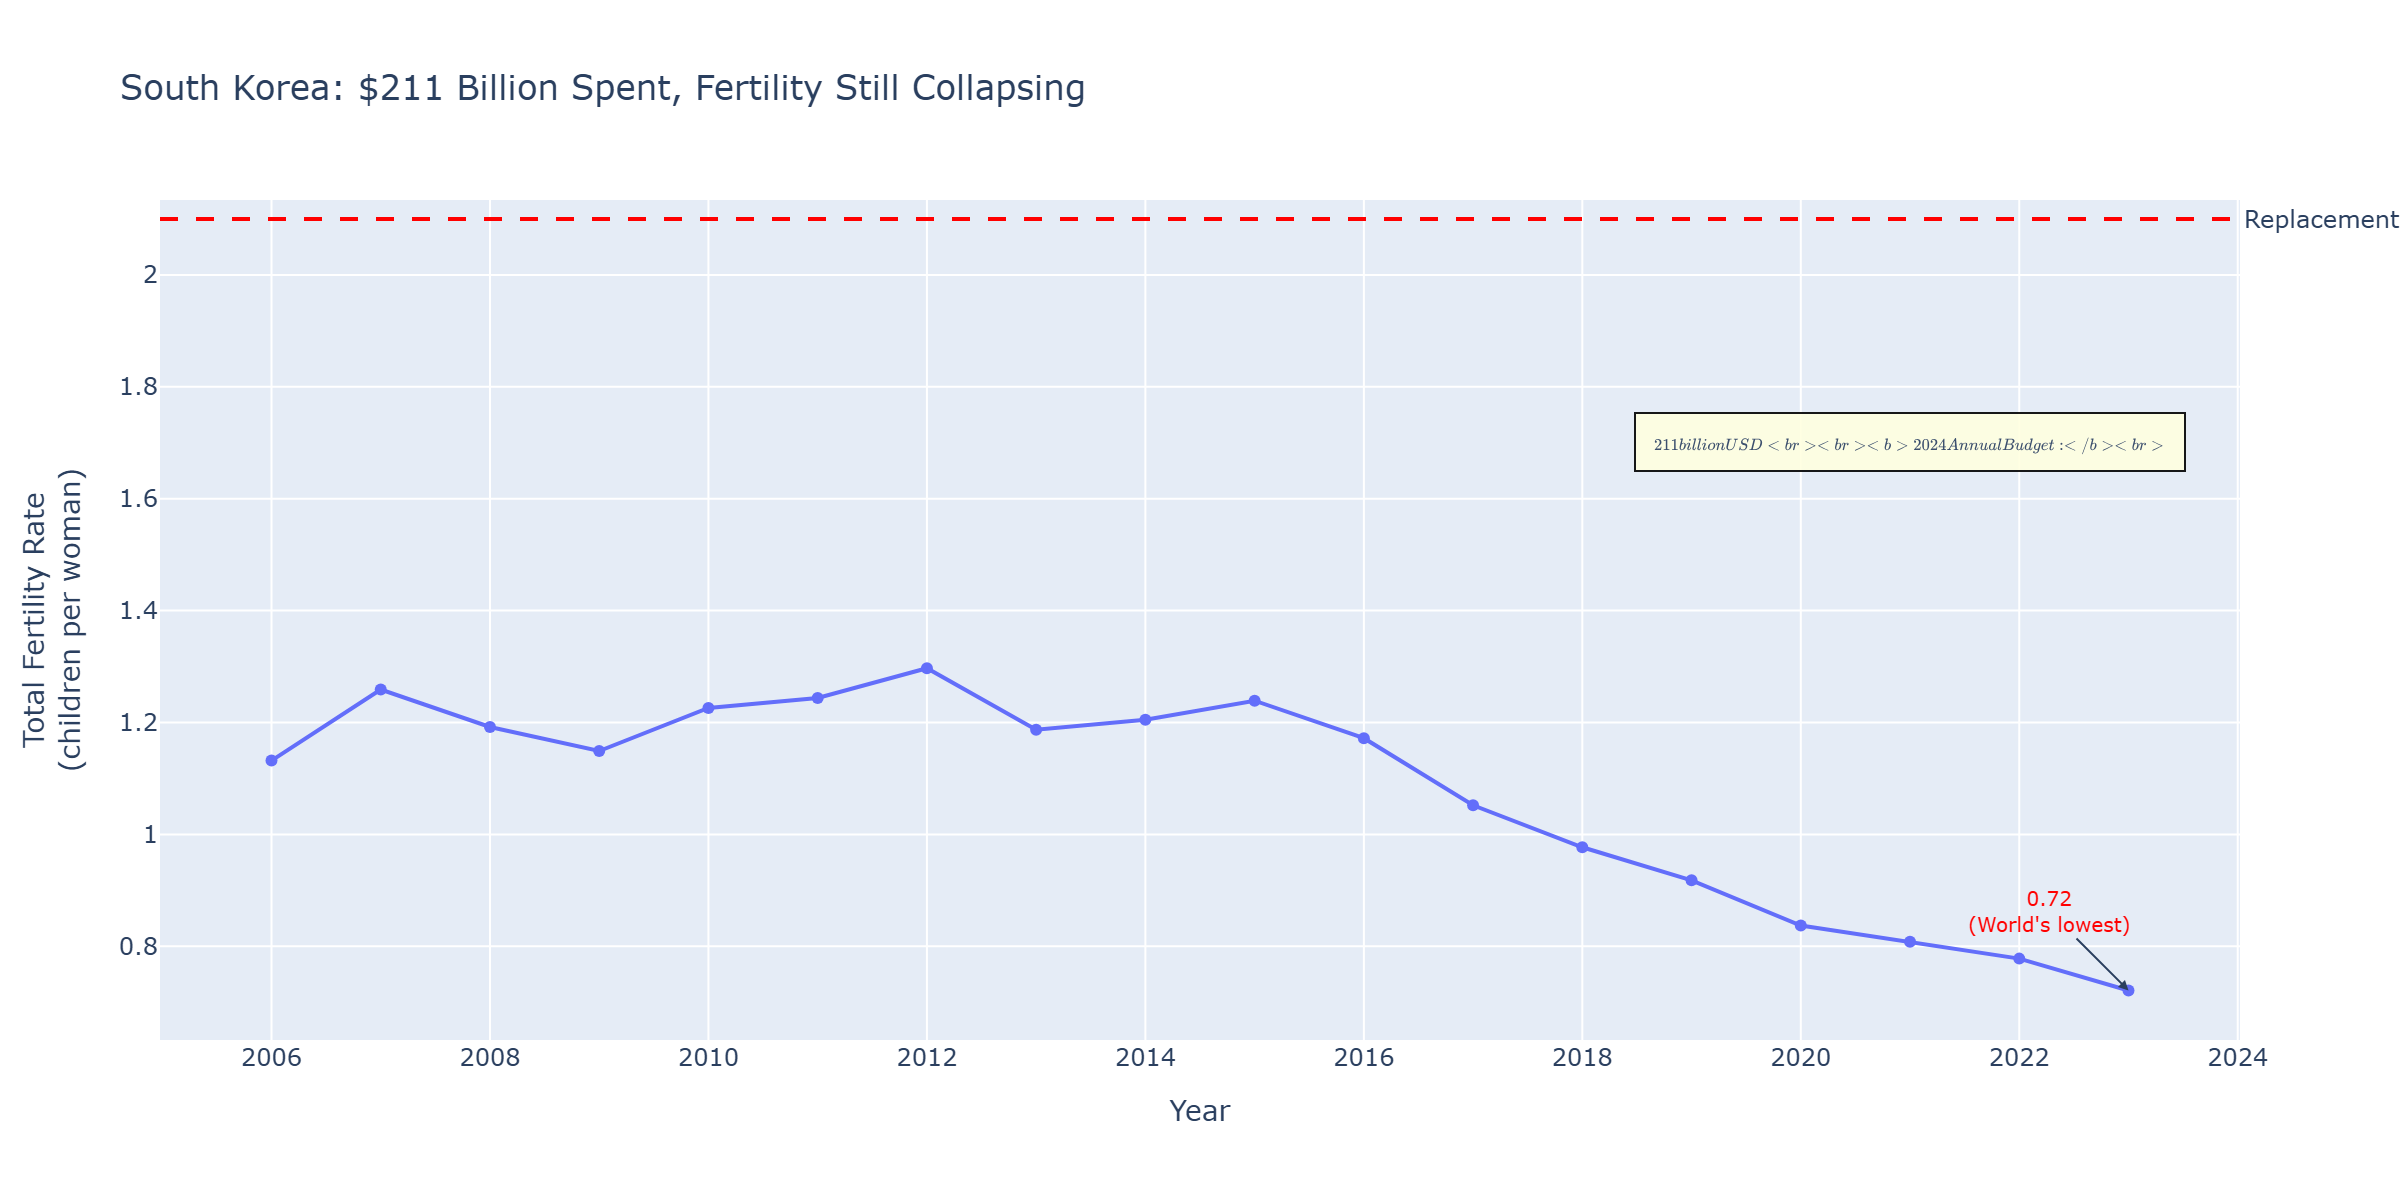
South Korea’s TFR in 2023:0.72
That’s not a typo. Less than one child per woman. The replacement level is 2.1. Korea is at 0.72.
The Korean government has spent $211 billion on pro-natalist policies between 2006 and 2024. That’s roughly $30 billion per year in recent years. Cash incentives, subsidized childcare, expanded parental leave, housing support—everything policymakers could think of.
The result? In 2006, when the spending began, TFR was 1.13. In 2024, it’s 0.72.
The fertility rate dropped 36% despite—or perhaps because of—the spending.
When I ran queries comparing Korea’s decline velocity to other countries from 2014 to 2023, the numbers were stark: Korea’s TFR dropped 40.2%. For context, the global average decline was around 12.8% over the same period. Korea is falling twice as fast as the world average.
China, starting from a higher baseline, dropped 43.5%. Thailand declined 18.3%. Even these numbers pale next to Korea’s velocity.
The Pattern Repeats
Korea isn’t alone in throwing money at the problem and watching it burn.
Hungary has been running aggressive pro-natalist programs for years—cash bonuses, tax exemptions, subsidized loans for families. TFR today: 1.51. Still well below replacement.
Singapore: 0.97 China: 0.99 Hong Kong: 0.75
The spending varies. The policies vary. The results don’t.
My analysis revealed another pattern: when I filtered for countries that dropped below 2.1 before 1990 and tracked them through 2024, not a single one recovered above replacement level permanently. Some stabilized around 1.7-1.8. Most kept falling.
So far, financial incentives alone haven’t proven sufficient to reverse the trend.
What the Future Looks Like
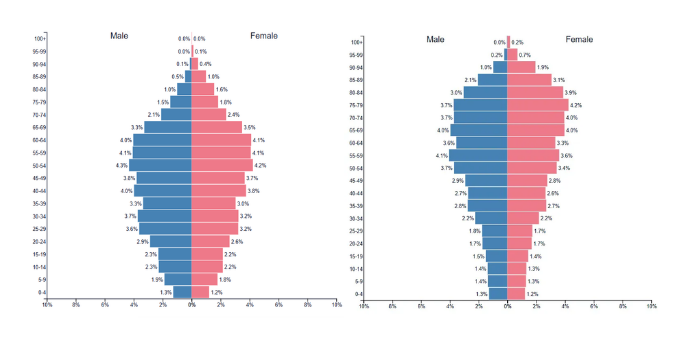
Source: PopulationPyramid.net | Data: UN World Population Prospects 2024
Population pyramids are supposed to look like… pyramids. Wide base of young people, narrow top of elderly.
Korea’s 2024 pyramid already looks strange—the base is narrowing. But look at the 2050 projection. It’s not a pyramid. It’s an inverted mushroom. The elderly population dwarfs the working-age population, which dwarfs the youth.
The UN projects Korea’s population will drop from 52 million (2024) to roughly 22 million by 2100. That’s a 58% population decline in 76 years.
Japan faces similar math: 124 million today, projected 77 million by 2100.
These aren’t projections based on catastrophe—no wars, no famines. Just math. When TFR stays at 0.7-1.2 for decades, populations collapse.
When Cash Fails, Governments Get Creative
Financial incentives haven’t worked. We’ve established that. South Korea spent $211 billion and watched fertility rates drop 36%. Hungary threw money at the problem for years—still at 1.51. Singapore tried everything short of mandating reproduction. Nothing moved the needle back toward 2.1.
So what’s the next play?
Governments are shifting strategy. Instead of just asking “how do we make children affordable?” they’re asking “how do we change the culture around having children?”
The United States: After the Dobbs decision in 2022, abortion access was restricted or eliminated in multiple states. Some politicians have been direct about the demographic angle. J.D. Vance, now Vice President, has talked openly about needing more children and criticized “childless cat ladies” in leadership positions. The demographic motivation is becoming explicit policy.
Hungary: Viktor Orbán’s government isn’t just offering money—it’s promoting a specific vision. The message is “have Hungarian kids to preserve Hungarian civilization.” LGBTQ+ rights are restricted. “Traditional family values” are written into the constitution. Immigration is rejected because it doesn’t produce the “right kind” of citizens.
Russia: Putin’s government has made “traditional values” a cornerstone of domestic policy. They offer maternal capital programs while restricting LGBTQ+ expression and foreign adoption.
These governments are trying a different approach: not just economic incentives, but cultural and legal pressure to reshape how people think about family and reproduction.
The results so far? The same as the financial approach: nothing.
Korea’s rate keeps dropping. Hungary’s still below 1.6. Russia’s demographic crisis continues. The methods are different, but the outcome is identical—populations keep shrinking.
What Happens Next?
I don’t have an answer—and judging by the data, neither do the governments spending billions on this.
The analysis I ran shows something striking: the velocity of decline is increasing. Countries that crossed the threshold recently (2000s-2010s) are falling faster than those that crossed in the 1970s-1980s.
South Korea went from 1.13 (2006) to 0.72 (2023) in 17 years—a 36% drop. Japan went from 2.23 (1974) to 1.42 (1990) in 16 years—a 36% drop.
Same percentage. Half the time period for Korea.
Whatever’s causing this, it’s speeding up.
What the data does show clearly:
- Once a country drops below 2.1, it doesn’t come back.
- Dependency ratios explode within 30-40 years.
- Government spending hasn’t reversed the trend anywhere.
- The decline is accelerating in recently-affected countries.
Sixty-four years ago, Czechia became the first country to cross this threshold. Today, 63 countries are below replacement level. The question isn’t “will more countries join them?”
The question is: what happens to a civilization when the pyramid collapses?
Technical Notes
Data Sources:
- World Bank Open Data: Fertility Rate (SP.DYN.TFRT.IN), Old-Age Dependency Ratio (SP.POP.DPND.OL)
- PopulationPyramid.net: Based on UN World Population Prospects 2024
Methodology:
- Analysis: Python (pandas, plotly) + PostgreSQL
- Database: 16,928 fertility records, 17,195 dependency records
- SQL queries for temporal analysis: replacement level crossing dates, decline velocity calculations (2014-2023), dependency ratio growth rates (1990-2024)
Key SQL Findings:
- Replacement level analysis: Identified first year below 2.1 TFR for each country using window functions and CTEs
- Decline velocity: Year-over-year percentage change calculation showing Korea’s 40.2% decline vs 12.8% global average
- Dependency growth: 34-year trend analysis showing Korea’s 290% increase vs Japan’s 191%
About This Analysis: This project began as an exploration of global demographic trends and evolved into a case study of policy failure. I started this project expecting to find at least one country where pro-natalist spending worked. I didn’t. Every country that threw money at the problem is still watching their birth rates fall.